> ## Documentation Index
> Fetch the complete documentation index at: https://docs.aisync.link/llms.txt
> Use this file to discover all available pages before exploring further.
# Execution Logs
> User guide for workflow run history: filters, table columns, status labels, and step-by-step details.
## 🧐 Overview
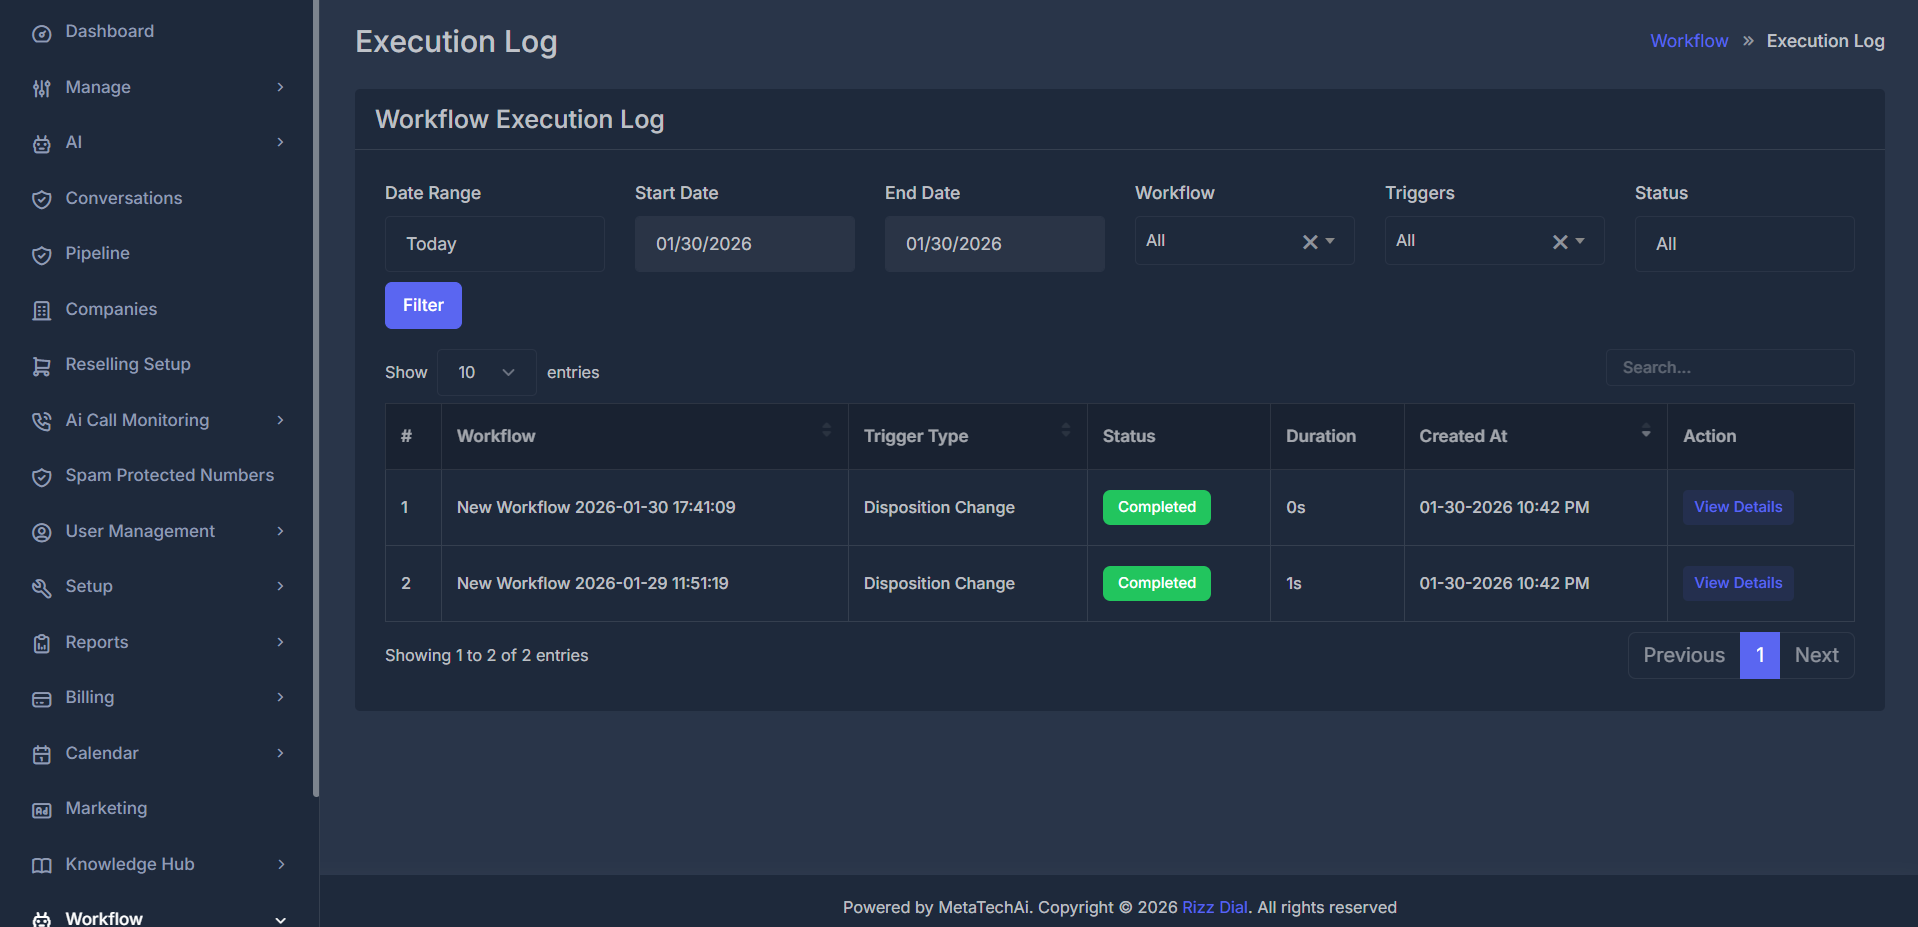
The **Execution log** is your workflow run history: it brings together every time a workflow has run for your organization. You see runs from **all** workflows in one place—not only a single workflow. Each row is one run: what started it, how it finished, how long it took, and when it was first recorded. You can narrow the list with filters, search within the table, view step-by-step detail for any run, and move between pages when there are many results.
 **👀 What you see when you open the screen**
At the top, the page title and navigation show that you are under **Workflow** and viewing the run history for workflows.
The main area has a title that describes this as the workflow run history, then a **filters** row, then a **table** of runs.
## 🛠️ Filters
**👀 What you see when you open the screen**
At the top, the page title and navigation show that you are under **Workflow** and viewing the run history for workflows.
The main area has a title that describes this as the workflow run history, then a **filters** row, then a **table** of runs.
## 🛠️ Filters
 ### **📅 Date range**
This controls which runs appear based on the **date each run was first recorded** (the same idea as the “Created at” column—not the time the workflow started or finished).
**Preset ranges** (pick one from the list):
| Option | What it covers |
| ---------------------------------- | --------------------------------------------------------------------- |
| **Custom dates** | You choose the start and end dates yourself. |
| **Today** | The current calendar day (this is the default when the screen loads). |
| **Yesterday** | The previous calendar day. |
| **This week (Sun – today)** | From the Sunday that started this week through today. |
| **This week (Mon – today)** | From the Monday that started this week through today. |
| **Last 7 days** | The seven days ending today. |
| **Last week (Sun – Sat)** | The previous full week, Sunday through Saturday. |
| **Last week (Mon – Sun)** | The previous full week, Monday through Sunday. |
| **Last business week (Mon – Fri)** | Monday through Friday of the previous week. |
| **Last 14 days** | The fourteen days ending today. |
| **This month** | From the first day of the current month through today. |
| **Last 30 days** | The thirty days ending today. |
| **Last month** | The full previous calendar month. |
**Start date** and **End date** fields show the range that applies. For every preset except **Custom dates**, those fields are filled in automatically and **cannot be edited**; changing the preset updates the range and refreshes the list.
For **Custom dates**:
* The start and end fields **can be edited**.
* You must click **Filter** to apply your chosen dates (the list does not refresh only from changing the dropdown).
For all other presets, changing the date range dropdown refreshes the list automatically; you do not need to click **Filter** for those.
The **Filter** button is always available; for custom dates it is what applies your start and end dates.
### **📝 Workflow**
* **All** — Every workflow’s runs are included.
* Any other choice — Only runs for that workflow.
You can **type to search** the workflow names in the list. Changing this selection refreshes the table.
### **🎯 Triggers**
* **All** — Every trigger type is included.
* A specific value — Only runs that began with that trigger.
The choices here are **only the trigger types that have actually occurred** for your organization’s runs (duplicates removed and sorted). If a trigger has never been used, it will not appear until it happens at least once.
You can **type to search** this list. Changing this selection refreshes the table.
### **🚦 Status**
* **All** — Every status is included.
* Otherwise — Only runs whose **overall** status matches your choice.
**Status values:**
| Status | Description |
| ------------- | ---------------------------------------------------- |
| **Pending** | The run is queued or not yet started. |
| **Running** | The run is currently in progress. |
| **Completed** | The run finished successfully. |
| **Failed** | The run ended due to an error. |
| **Cancelled** | The run was intentionally stopped before completion. |
| **Paused** | The run is temporarily halted and may be resumed. |
Changing this selection refreshes the table.
## 📊 Main table
### **📅 Date range**
This controls which runs appear based on the **date each run was first recorded** (the same idea as the “Created at” column—not the time the workflow started or finished).
**Preset ranges** (pick one from the list):
| Option | What it covers |
| ---------------------------------- | --------------------------------------------------------------------- |
| **Custom dates** | You choose the start and end dates yourself. |
| **Today** | The current calendar day (this is the default when the screen loads). |
| **Yesterday** | The previous calendar day. |
| **This week (Sun – today)** | From the Sunday that started this week through today. |
| **This week (Mon – today)** | From the Monday that started this week through today. |
| **Last 7 days** | The seven days ending today. |
| **Last week (Sun – Sat)** | The previous full week, Sunday through Saturday. |
| **Last week (Mon – Sun)** | The previous full week, Monday through Sunday. |
| **Last business week (Mon – Fri)** | Monday through Friday of the previous week. |
| **Last 14 days** | The fourteen days ending today. |
| **This month** | From the first day of the current month through today. |
| **Last 30 days** | The thirty days ending today. |
| **Last month** | The full previous calendar month. |
**Start date** and **End date** fields show the range that applies. For every preset except **Custom dates**, those fields are filled in automatically and **cannot be edited**; changing the preset updates the range and refreshes the list.
For **Custom dates**:
* The start and end fields **can be edited**.
* You must click **Filter** to apply your chosen dates (the list does not refresh only from changing the dropdown).
For all other presets, changing the date range dropdown refreshes the list automatically; you do not need to click **Filter** for those.
The **Filter** button is always available; for custom dates it is what applies your start and end dates.
### **📝 Workflow**
* **All** — Every workflow’s runs are included.
* Any other choice — Only runs for that workflow.
You can **type to search** the workflow names in the list. Changing this selection refreshes the table.
### **🎯 Triggers**
* **All** — Every trigger type is included.
* A specific value — Only runs that began with that trigger.
The choices here are **only the trigger types that have actually occurred** for your organization’s runs (duplicates removed and sorted). If a trigger has never been used, it will not appear until it happens at least once.
You can **type to search** this list. Changing this selection refreshes the table.
### **🚦 Status**
* **All** — Every status is included.
* Otherwise — Only runs whose **overall** status matches your choice.
**Status values:**
| Status | Description |
| ------------- | ---------------------------------------------------- |
| **Pending** | The run is queued or not yet started. |
| **Running** | The run is currently in progress. |
| **Completed** | The run finished successfully. |
| **Failed** | The run ended due to an error. |
| **Cancelled** | The run was intentionally stopped before completion. |
| **Paused** | The run is temporarily halted and may be resumed. |
Changing this selection refreshes the table.
## 📊 Main table
 **🧾 Columns**
| Column | What it shows |
| ---------------- | --------------------------------------------------------------------------------------------------------------------------------------------------------------------------------------------- |
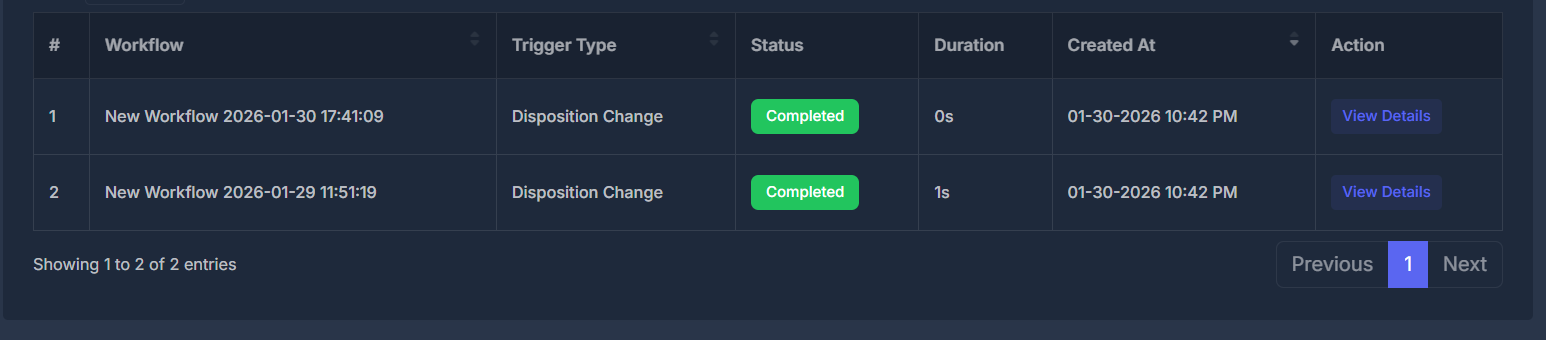
| **#** | The row number on the **current page** (if you go to page 2, numbering starts again for that page). |
| **Workflow** | The name of the workflow that ran. If a name cannot be shown, **N/A** may appear. |
| **Trigger type** | What caused this run. Words are shown in a normal, readable form (for example, spaces instead of internal separators in the name). |
| **Status** | The overall outcome of the run, shown as a **colored label** (see [Status labels (colors)](#status-labels-colors) below). |
| **Duration** | How long the run took **from start to finish**, shown as hours, minutes, and seconds when both times exist. If start or finish time is missing for measuring length, a dash (**–**) is shown. |
| **Created at** | When this run was **first recorded** in the system, shown in **your** time zone (the time zone set on your user profile). Rows are ordered with the **newest** created time first by default. |
| **Action** | A control to **View details** for that run (see below). |
**🔍 Search**
Above the table there is a **search** field (the placeholder may read “Search…”). You can type to narrow rows by text that appears in supported columns—for example workflow name, trigger wording, or parts of the created date.
**⏳ While the table updates**
When you change filters, search, sorting, or page, the table may briefly indicate that it is **loading** or **processing** before the new rows appear.
**📄 Pages and page size**
You can choose how many rows appear on each page. The default is **10** rows per page. Use the paging controls to move between pages when there are more results than fit on one page.
**🟦 Status labels (colors)**
Overall run status uses colored labels so you can scan quickly:
* **Pending** — Usually a warning-style (amber/yellow) tone.
* **Running** — Usually an informational (blue) tone.
* **Completed** — Usually a success (green) tone.
* **Failed** — Usually an error (red) tone.
* **Cancelled** or **Paused** — Usually a neutral (gray) tone.
Exact colors follow the product’s standard styling.
## 🔎 View details
Click **View details** on any row to open a panel. While the content loads, a short **loading** indicator appears.
**🧾 Columns**
| Column | What it shows |
| ---------------- | --------------------------------------------------------------------------------------------------------------------------------------------------------------------------------------------- |
| **#** | The row number on the **current page** (if you go to page 2, numbering starts again for that page). |
| **Workflow** | The name of the workflow that ran. If a name cannot be shown, **N/A** may appear. |
| **Trigger type** | What caused this run. Words are shown in a normal, readable form (for example, spaces instead of internal separators in the name). |
| **Status** | The overall outcome of the run, shown as a **colored label** (see [Status labels (colors)](#status-labels-colors) below). |
| **Duration** | How long the run took **from start to finish**, shown as hours, minutes, and seconds when both times exist. If start or finish time is missing for measuring length, a dash (**–**) is shown. |
| **Created at** | When this run was **first recorded** in the system, shown in **your** time zone (the time zone set on your user profile). Rows are ordered with the **newest** created time first by default. |
| **Action** | A control to **View details** for that run (see below). |
**🔍 Search**
Above the table there is a **search** field (the placeholder may read “Search…”). You can type to narrow rows by text that appears in supported columns—for example workflow name, trigger wording, or parts of the created date.
**⏳ While the table updates**
When you change filters, search, sorting, or page, the table may briefly indicate that it is **loading** or **processing** before the new rows appear.
**📄 Pages and page size**
You can choose how many rows appear on each page. The default is **10** rows per page. Use the paging controls to move between pages when there are more results than fit on one page.
**🟦 Status labels (colors)**
Overall run status uses colored labels so you can scan quickly:
* **Pending** — Usually a warning-style (amber/yellow) tone.
* **Running** — Usually an informational (blue) tone.
* **Completed** — Usually a success (green) tone.
* **Failed** — Usually an error (red) tone.
* **Cancelled** or **Paused** — Usually a neutral (gray) tone.
Exact colors follow the product’s standard styling.
## 🔎 View details
Click **View details** on any row to open a panel. While the content loads, a short **loading** indicator appears.
 **📋 Summary section**
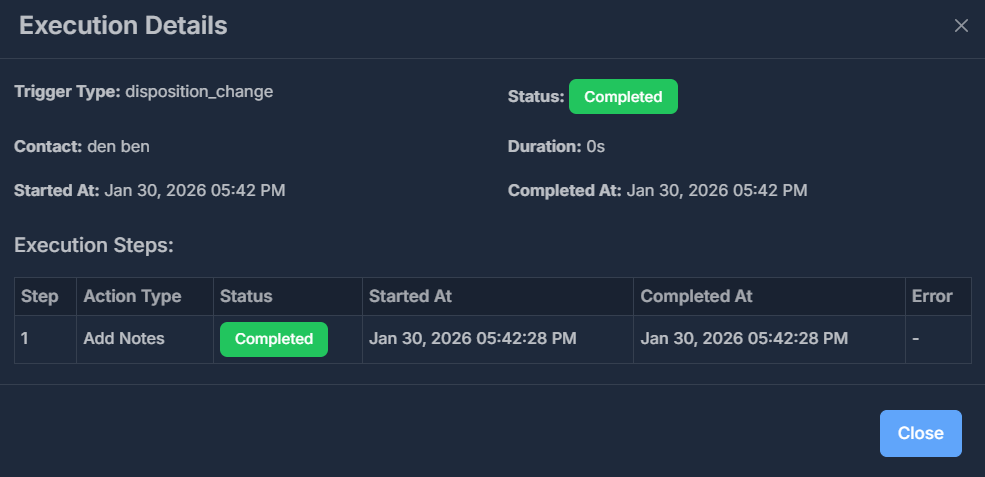
| Field | What it shows |
| ---------------- | ------------------------------------------------------------------------------------------------------------------------------------------------------------------------------------------------------------- |
| **Trigger type** | The same trigger as in the table; the wording may match exactly how that trigger is stored for your organization. |
| **Status** | The same overall status as in the table, as a colored label. |
| **Contact** | The person linked to this run, when one exists: usually their name, or a reference like “Contact #\[number]” if there is no display name, or **Unknown** when no contact is linked. |
| **Duration** | Total time for the full run, built from start and finish times. Long spans may show hours and minutes; shorter ones may show minutes and seconds or only seconds. If timing is incomplete, a dash may appear. |
| **Started at** | When the run began (date and time in a standard format), or **–** if unknown. |
| **Completed at** | When the run ended, or **–** if not finished or unknown. |
If the whole run failed, an **error** message for the run may appear in a highlighted area.
**📋 Summary section**
| Field | What it shows |
| ---------------- | ------------------------------------------------------------------------------------------------------------------------------------------------------------------------------------------------------------- |
| **Trigger type** | The same trigger as in the table; the wording may match exactly how that trigger is stored for your organization. |
| **Status** | The same overall status as in the table, as a colored label. |
| **Contact** | The person linked to this run, when one exists: usually their name, or a reference like “Contact #\[number]” if there is no display name, or **Unknown** when no contact is linked. |
| **Duration** | Total time for the full run, built from start and finish times. Long spans may show hours and minutes; shorter ones may show minutes and seconds or only seconds. If timing is incomplete, a dash may appear. |
| **Started at** | When the run began (date and time in a standard format), or **–** if unknown. |
| **Completed at** | When the run ended, or **–** if not finished or unknown. |
If the whole run failed, an **error** message for the run may appear in a highlighted area.