

🧐 Overview
The Execution log is your workflow run history: it brings together every time a workflow has run for your organization. You see runs from all workflows in one place—not only a single workflow. Each row is one run: what started it, how it finished, how long it took, and when it was first recorded. You can narrow the list with filters, search within the table, view step-by-step detail for any run, and move between pages when there are many results.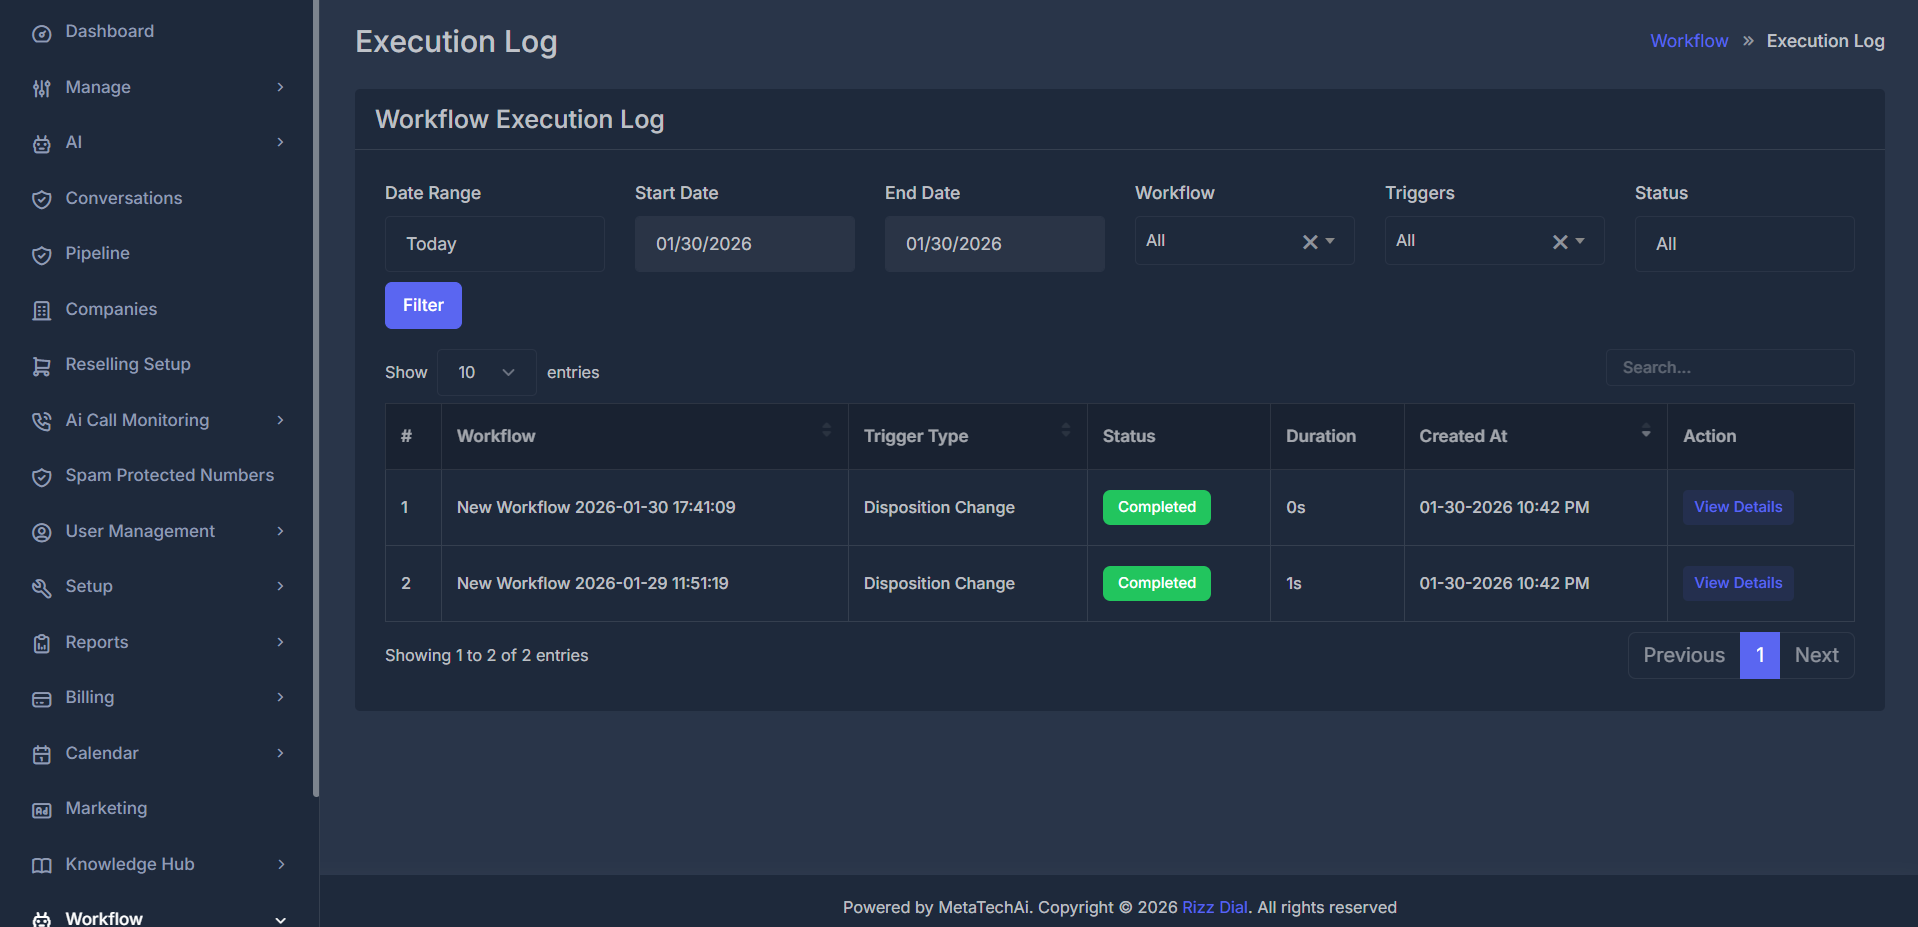
🛠️ Filters

📅 Date range
This controls which runs appear based on the date each run was first recorded (the same idea as the “Created at” column—not the time the workflow started or finished). Preset ranges (pick one from the list):
Start date and End date fields show the range that applies. For every preset except Custom dates, those fields are filled in automatically and cannot be edited; changing the preset updates the range and refreshes the list.
For Custom dates:
- The start and end fields can be edited.
- You must click Filter to apply your chosen dates (the list does not refresh only from changing the dropdown).
📝 Workflow
- All — Every workflow’s runs are included.
- Any other choice — Only runs for that workflow.
🎯 Triggers
- All — Every trigger type is included.
- A specific value — Only runs that began with that trigger.
🚦 Status
- All — Every status is included.
- Otherwise — Only runs whose overall status matches your choice.
Changing this selection refreshes the table.
📊 Main table
🔍 Search
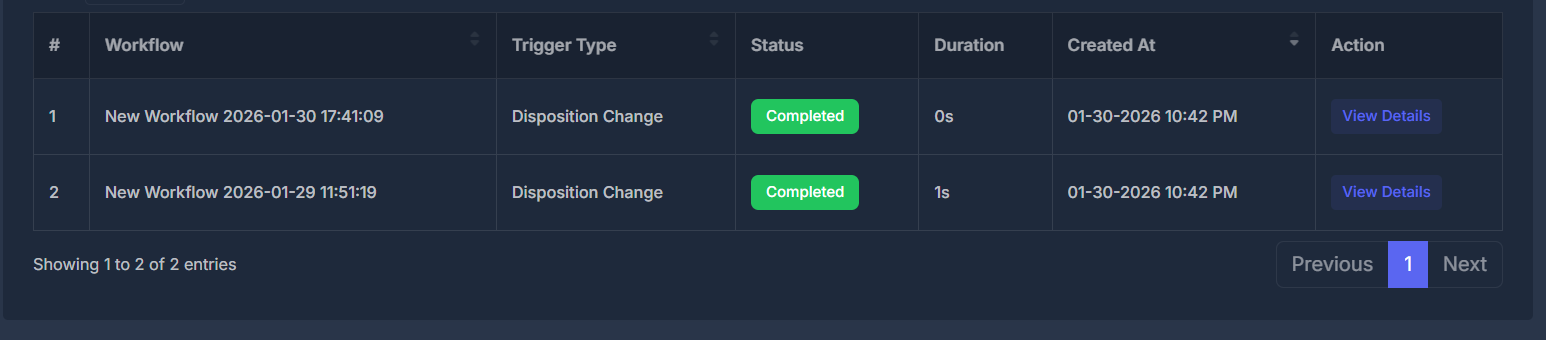
Above the table there is a search field (the placeholder may read “Search…”). You can type to narrow rows by text that appears in supported columns—for example workflow name, trigger wording, or parts of the created date.
⏳ While the table updates
When you change filters, search, sorting, or page, the table may briefly indicate that it is loading or processing before the new rows appear.
📄 Pages and page size
You can choose how many rows appear on each page. The default is 10 rows per page. Use the paging controls to move between pages when there are more results than fit on one page.
🟦 Status labels (colors)
Overall run status uses colored labels so you can scan quickly:
- Pending — Usually a warning-style (amber/yellow) tone.
- Running — Usually an informational (blue) tone.
- Completed — Usually a success (green) tone.
- Failed — Usually an error (red) tone.
- Cancelled or Paused — Usually a neutral (gray) tone.
🔎 View details
Click View details on any row to open a panel. While the content loads, a short loading indicator appears.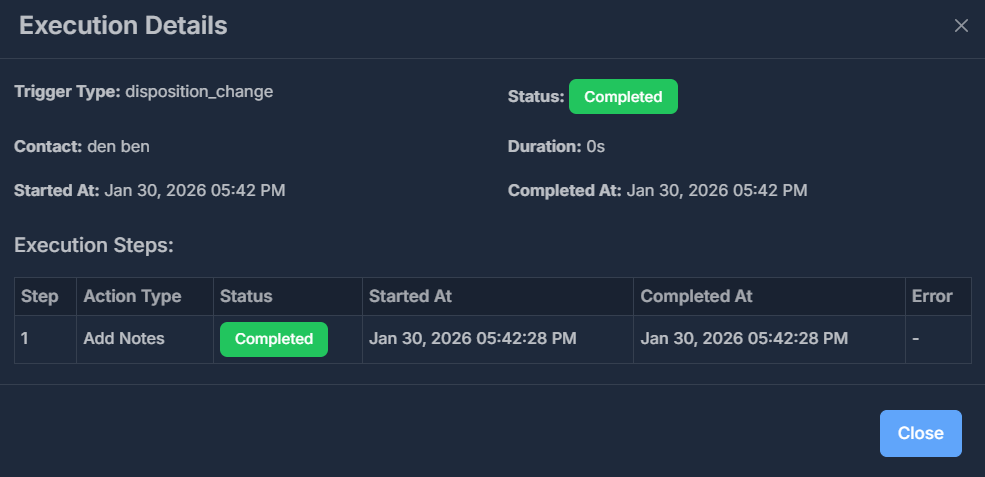
If the whole run failed, an error message for the run may appear in a highlighted area.