📊 AI Call Monitoring Dashboard
The AI Call Monitoring Dashboard provides comprehensive real-time analytics and insights for your call center operations. This powerful dashboard helps you monitor performance, track key metrics, and optimize your call center efficiency.🔍 Overview
The dashboard is designed with a dark theme and features multiple sections for different types of analytics:- Top Navigation & Filters - Control and filter your data view
- Key Performance Indicators (KPIs) - Quick overview of essential metrics
- Analytics Charts - Detailed visualizations of call data and trends
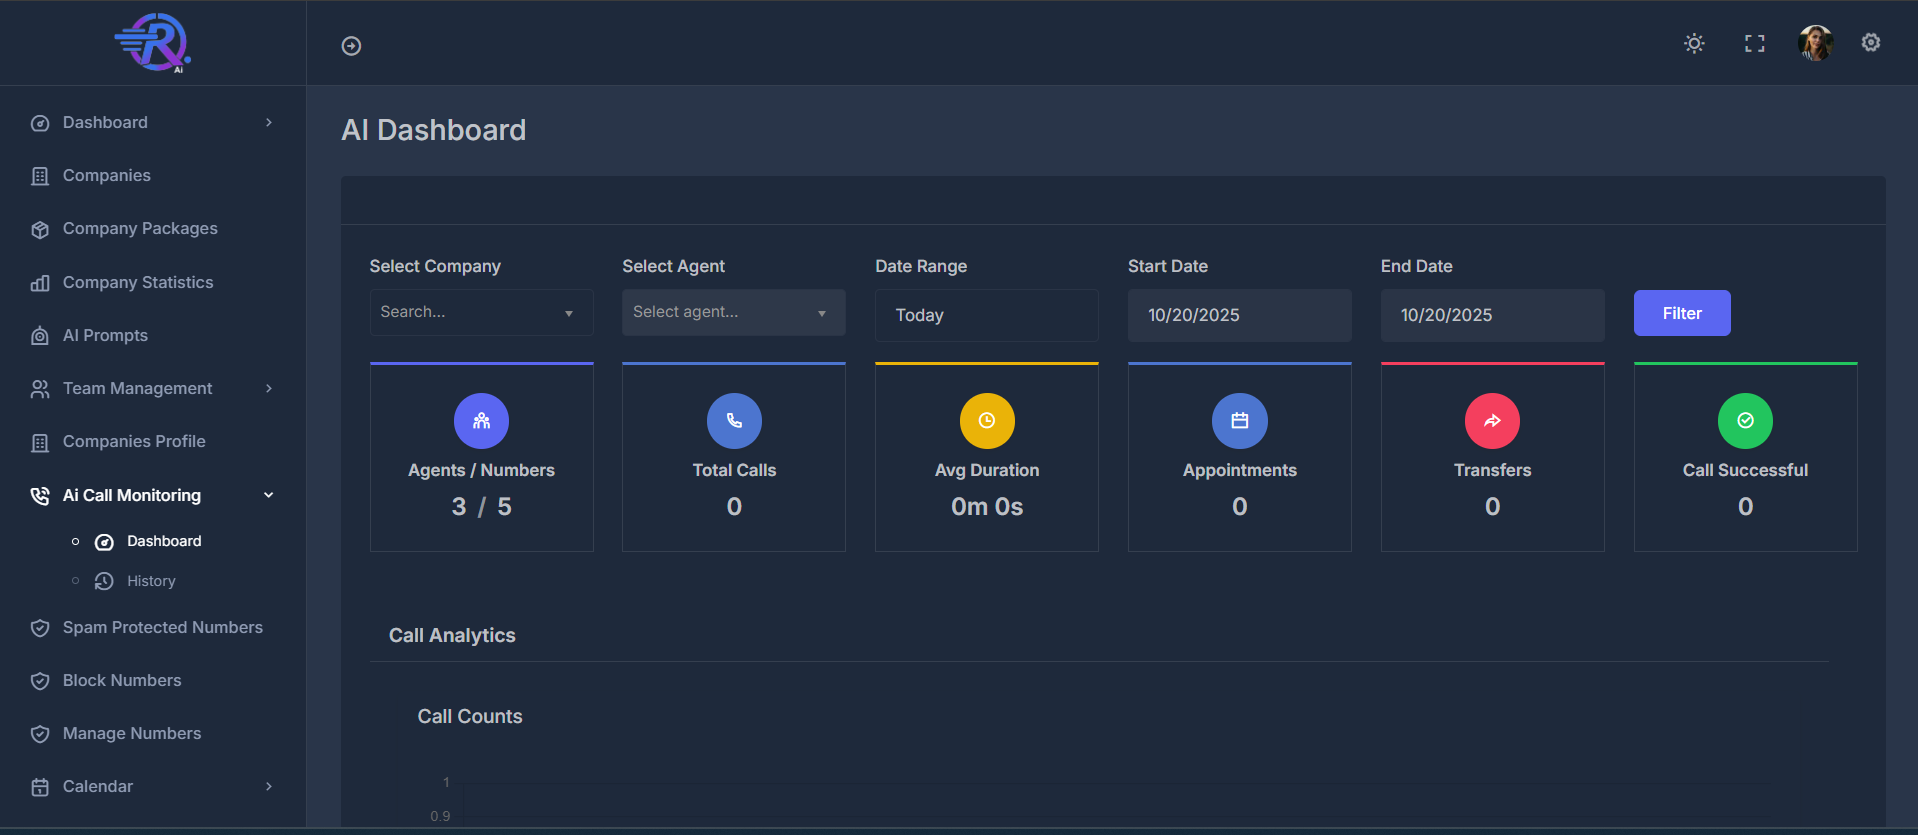
🎛️ Top Navigation & Filters
🎮 Main Controls
- Dialer Button - Quick access to dialer functionality
- Search Bar - Search across all data
- Filter Button - Apply selected filters
🔧 Filter Options
🏢 Company Selection
- Filter data by specific companies
👤 Agent Selection
- Filter data by individual agents
📅 Date Range Controls
- Set custom date ranges for data analysis
⚙️ Utility Icons
- Theme toggle, full-screen mode, settings, and user profile
📈 Key Performance Indicators (KPIs)
The KPI cards provide a quick overview of essential call center metrics at a glance.1. 👥 Agents / Numbers
- Active agents and available phone numbers
2. 📞 Total Calls
- Total calls made within the selected time period
3. ⏱️ Average Duration
- Average length of calls
4. 📅 Appointments
- Appointments scheduled from calls
5. 🔄 Transfers
- Calls transferred to other agents or departments
6. ✅ Call Successful
- Successful calls meeting defined criteria
📊 Analytics Charts & Visualizations
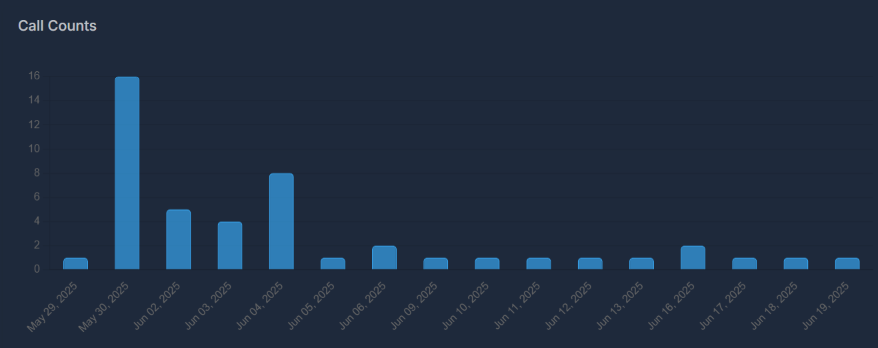
The dashboard features multiple chart types to provide comprehensive insights:📈 Call Volume Analytics
📊 Call Counts (Bar Chart)
- Track daily call volume trends
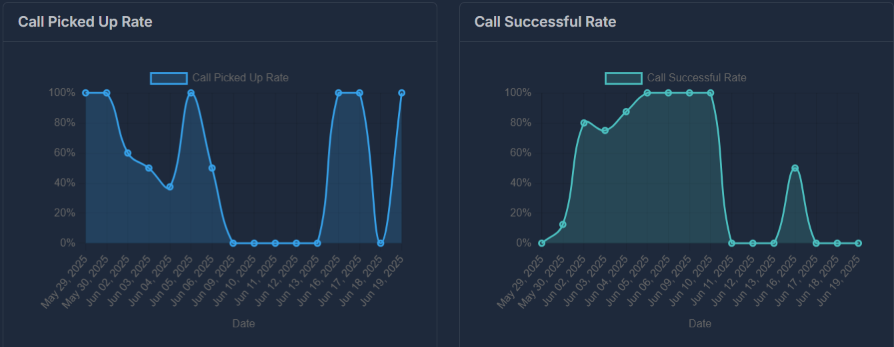
📞 Call Picked Up Rate (Line Chart)
- Monitor how often calls are answered
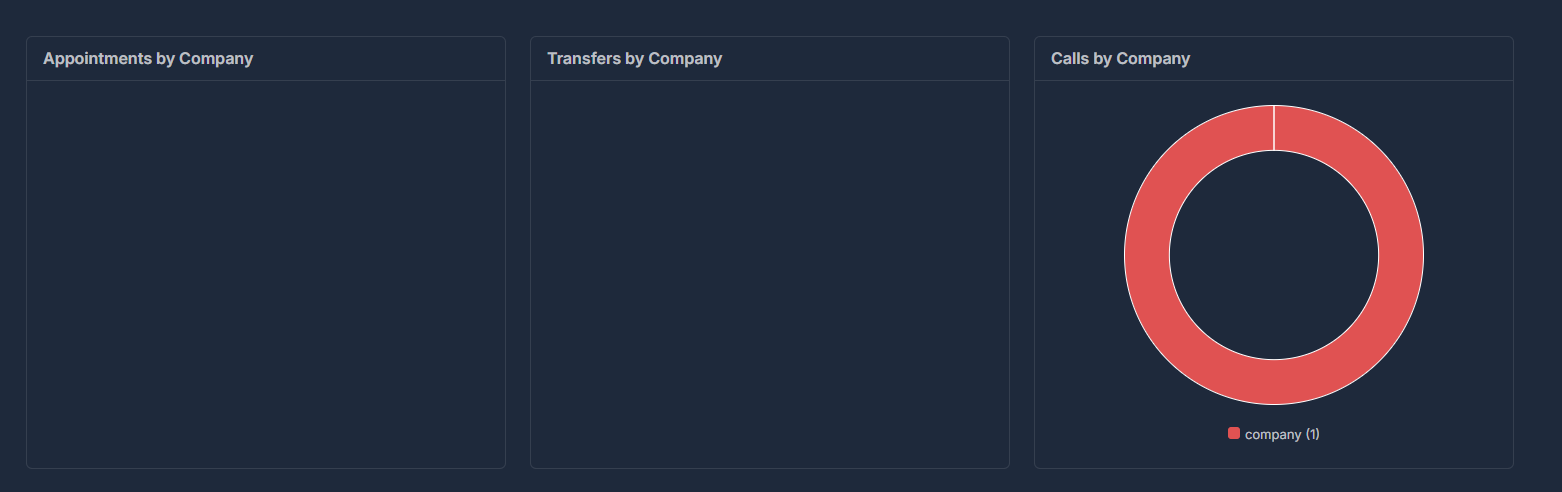
🏢 Company Performance Overview
The dashboard displays company-based analytics in a three-column layout for easy comparison:📅 Appointments by Company
- Compare the number of appointments scheduled by each company.
🔄 Transfers by Company
- See how many call transfers occur per company.
🍩 Calls by Company (Donut Chart)
- Visualize the distribution of calls by company.
🏢 Company Performance
📅 Appointments by Company
- Track appointment scheduling by company
🔄 Transfers by Company
- Monitor call transfers by company
🍩 Calls by Company (Donut Chart)
- Visualize call distribution across companies
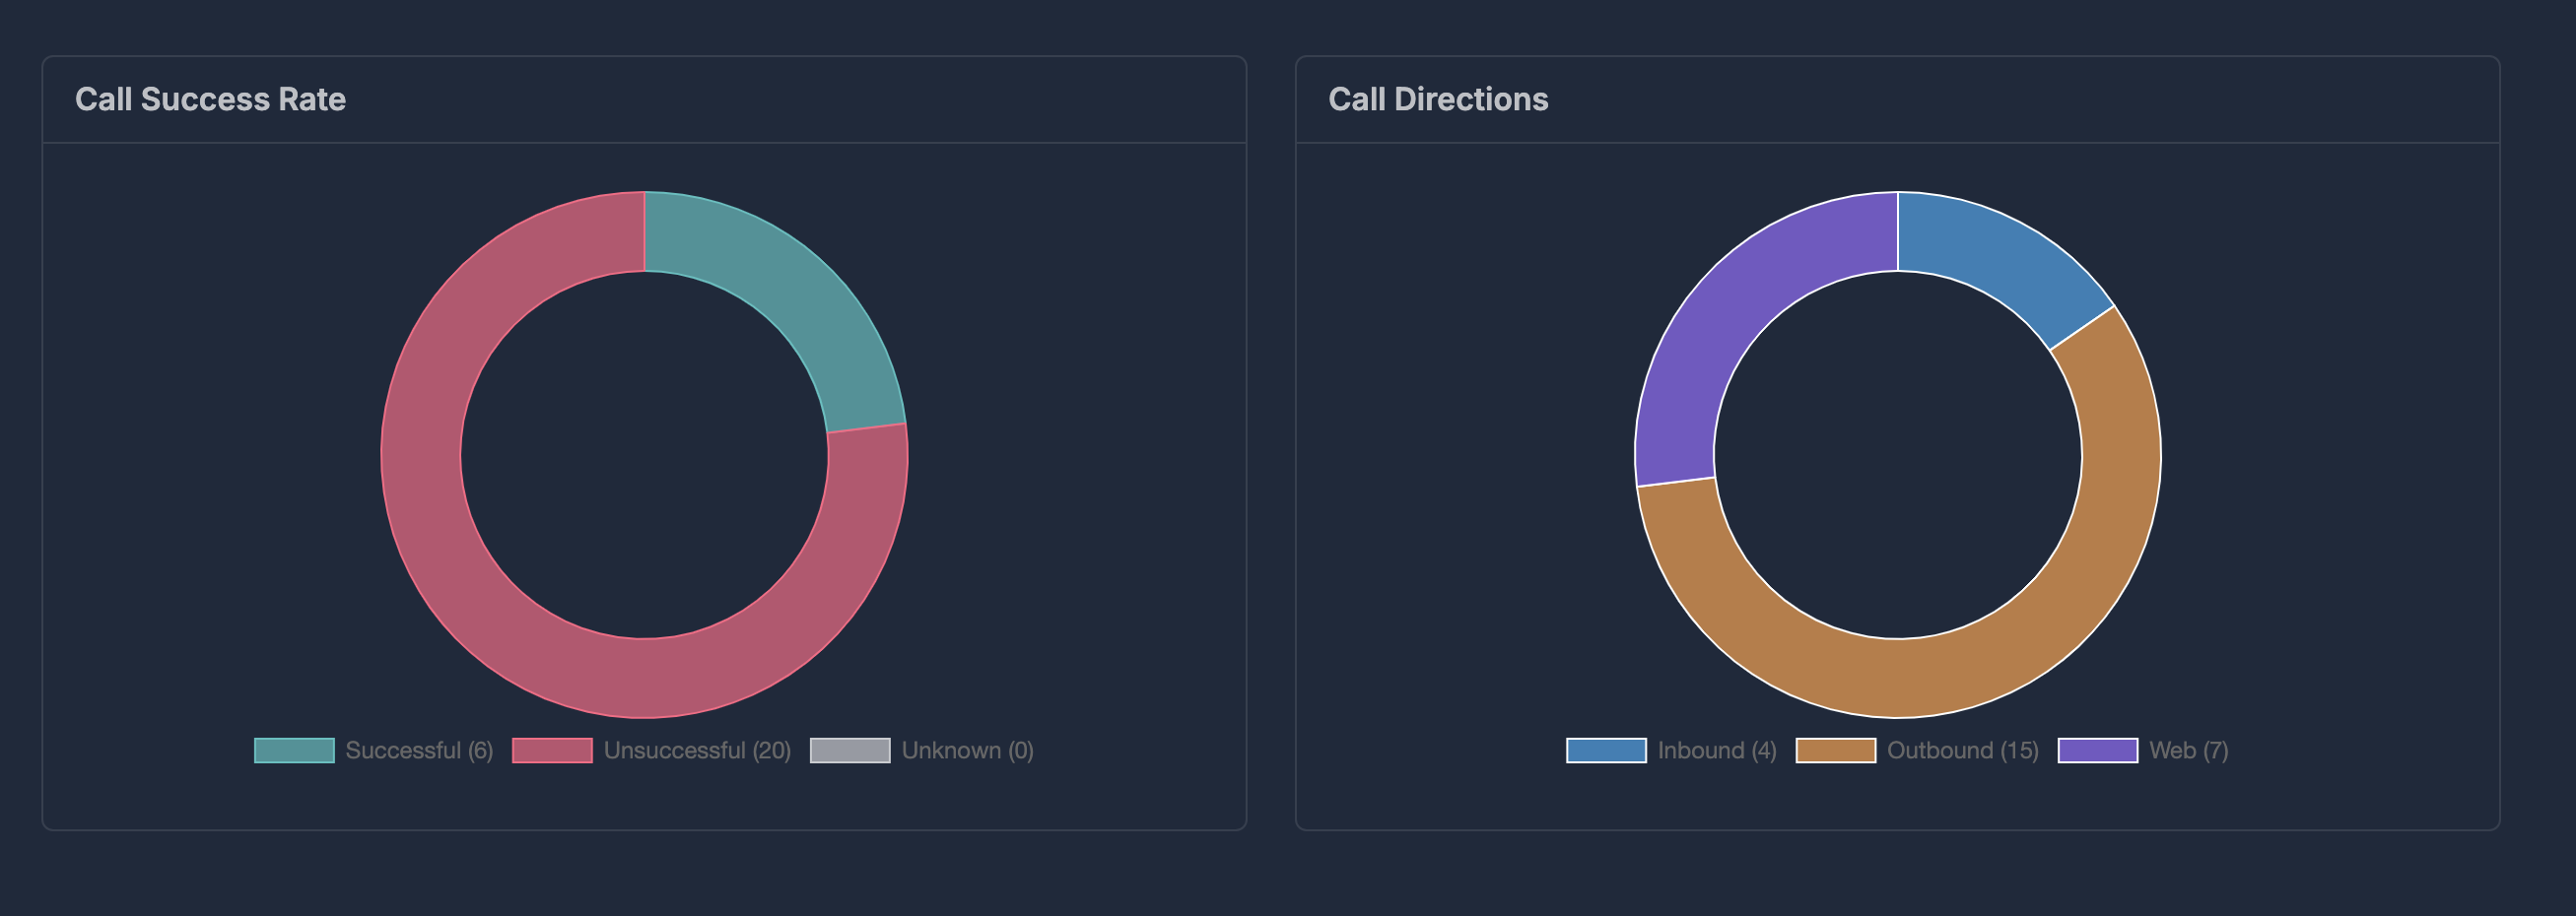
🎯 Call Quality Metrics
✅ Call Success Rate (Donut Chart)
- Track overall call success rates
🧭 Call Directions (Donut Chart)
- Analyze call source distribution
❌ Disconnection Reasons (Donut Chart)
- Understand why calls end
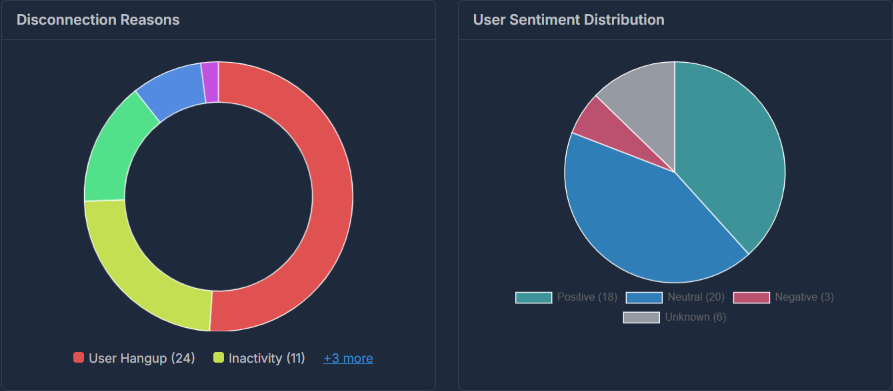
😊 User Experience Analytics
😊 User Sentiment Distribution (Pie Chart)
- Monitor customer satisfaction and sentiment
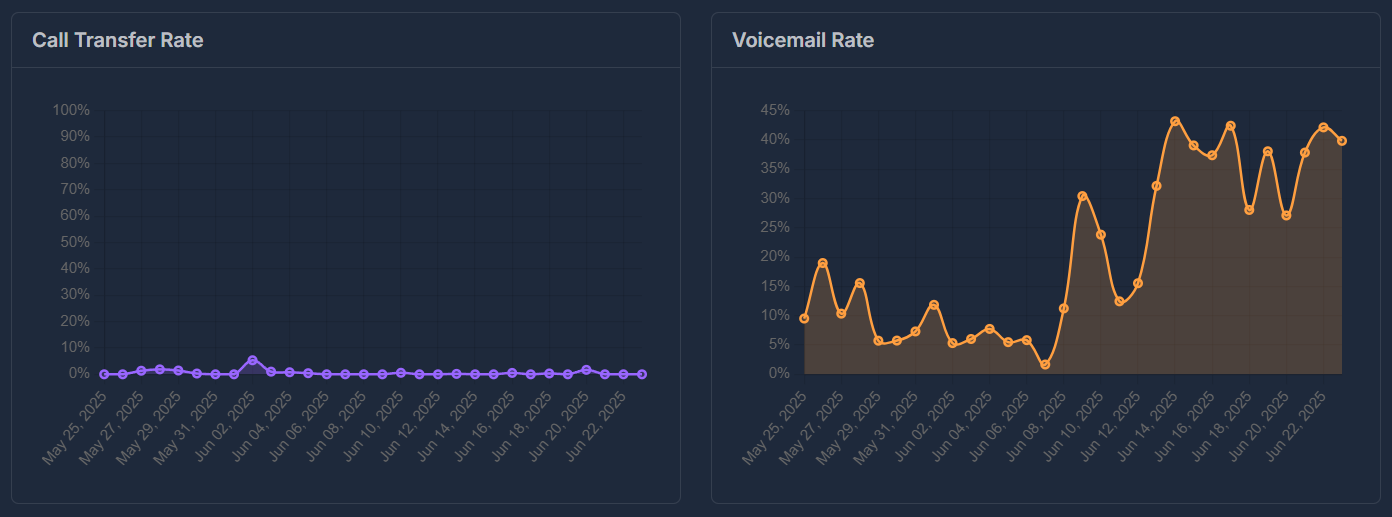
📈 Performance Trends
✅ Call Successful Rate (Line Chart)
- Track success rate trends over time
🔄 Call Transfer Rate (Line Chart)
- Monitor transfer rate trends
📧 Voicemail Rate (Line Chart)
- Track voicemail usage patterns
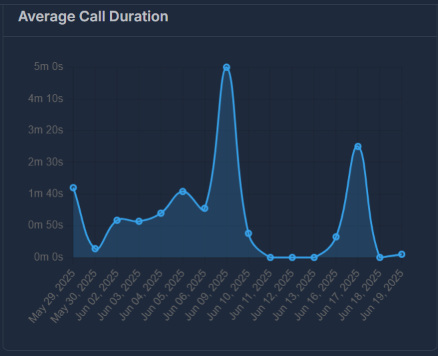
⏱️ Average Call Duration (Line Chart)
- Monitor call length trends
📊 Additional Analytics
📅 Appointments Panel
- Track appointment scheduling trends
🔍 Data Interpretation
📊 Current Sample Data
The dashboard shows data for a single call event, which explains why many charts show limited data points.💡 Best Practices
🎯 Using the Dashboard Effectively
- Set Date Ranges: Use date picker for relevant time periods
- Filter Data: Use company/agent filters for specific areas
- Monitor Trends: Watch line charts for performance trends
- Track KPIs: Check KPI cards for quick overview
- Analyze Sentiment: Use sentiment data to improve experience
📊 Interpreting Charts
- Donut Charts: Show distribution and proportions
- Line Charts: Display trends over time
- Bar Charts: Compare quantities across categories