📊 Overview
The AI Dashboard is a central overview of your AI assistants and the calls handled by them. Here you can see how many agents and phone numbers you have, how many calls occurred in a chosen period, how long calls lasted on average, how many were successful, how many appointments were booked, and why calls ended. Charts and tables below help you explore the details.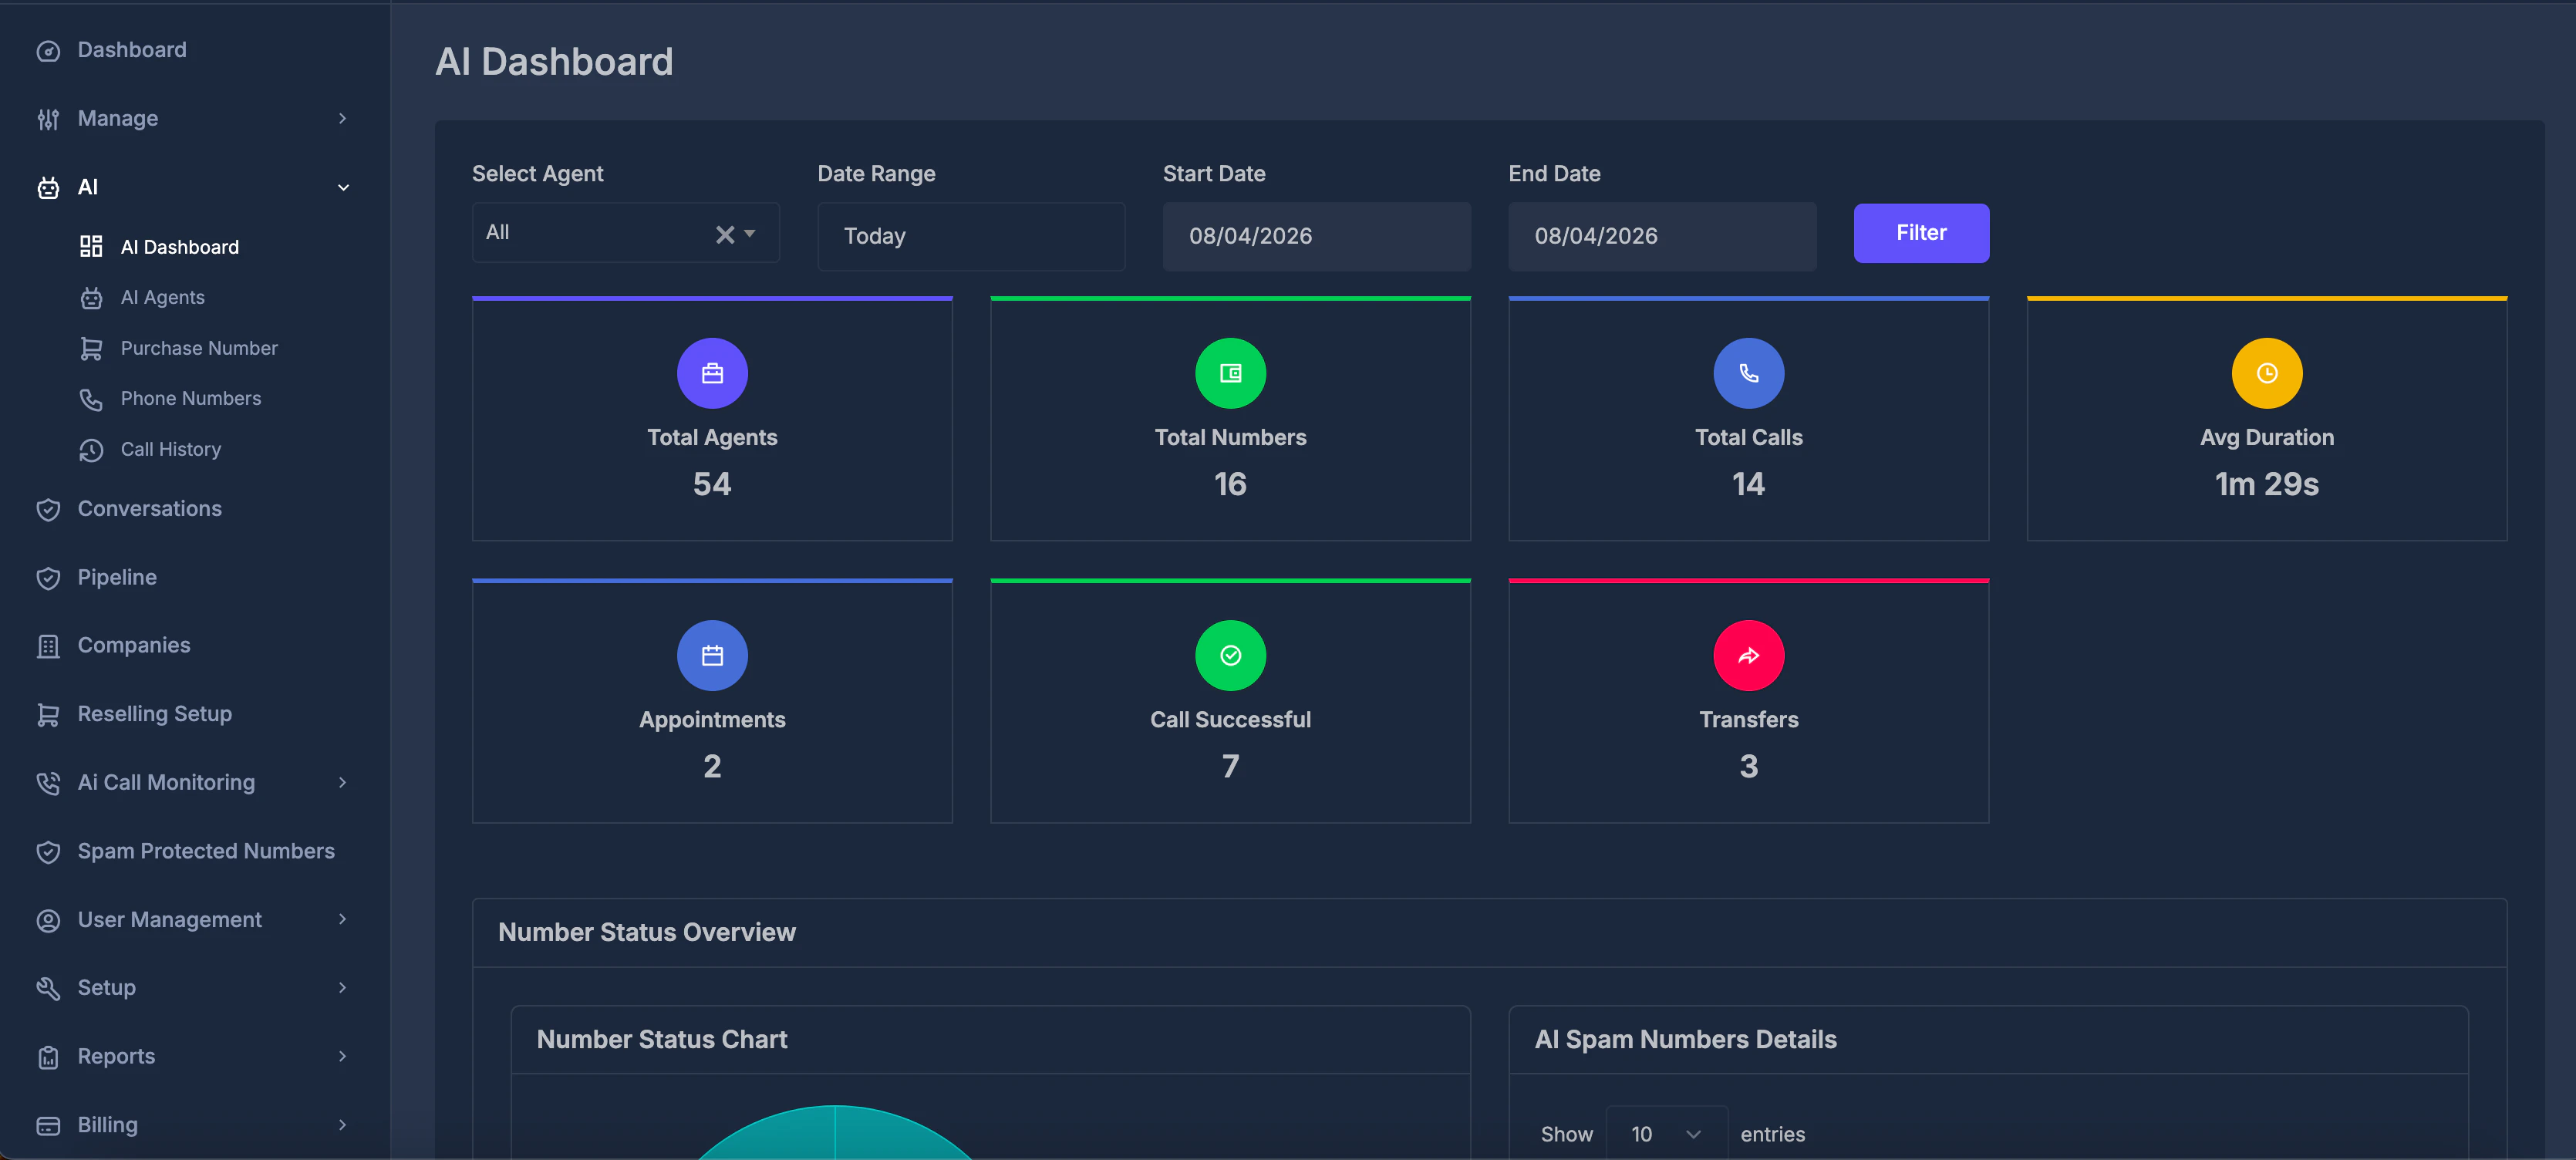
🧰 Filters (top row)
This row controls which agent and which date range the overview uses.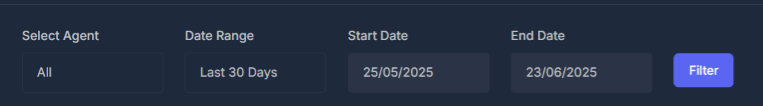
- All — data for every AI agent combined.
- Choosing a named agent limits the overview to that agent’s calls and metrics.
- Changing the agent usually refreshes the overview automatically; if not, press Filter.
- If you choose Custom dates, the Start Date and End Date fields become active. Set your range, then press Filter.
- For other presets, start and end dates are set for you and those fields stay inactive; the overview may refresh on its own.
- Used only with Custom dates.
- Charts and summary cards follow the period you define here once you apply the filter.
- Use this after changing dates or when the screen does not refresh by itself. It updates all related numbers and charts for your current choices.
📈 Summary cards
Each card shows one key figure. Hovering (or focusing) on a card may show a short explanation.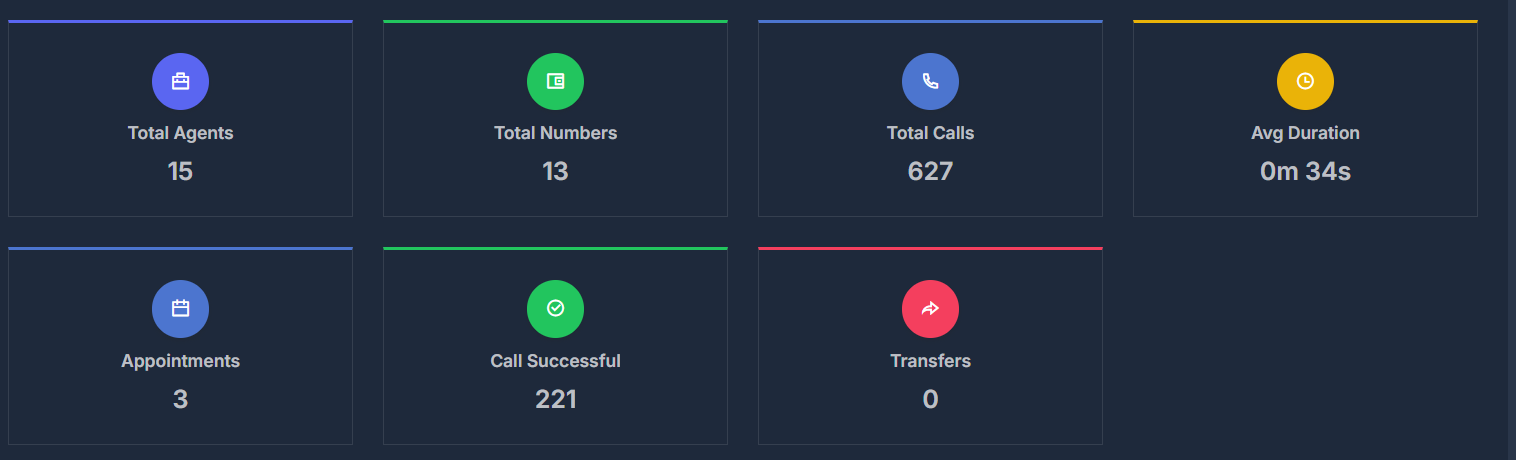
- The number of all AI agents in your account, whether active or inactive.
- This count does not depend on the date filter; it describes your overall setup.
- The total count of phone numbers used with your AI setup.
- One agent can have more than one number.
- All calls in the selected date range and selected agent scope, including inbound and outbound.
- The average length of calls in that period, shown in minutes and seconds.
- Calls where an appointment date and time was recorded.
- Clicking this card opens the Appointment Details panel .
- Calls marked as successful (yes).
- Calls that ended with a transfer to another destination.
🚦 Number Status Overview
This section focuses on spam or risk status of your numbers. It reflects the current status of numbers more than a single call date. 📊 Number Status Chart- A chart comparing Clean and Flagged numbers.
- Counts shown beside the chart:
- Clean Numbers
- Flagged Numbers
- Total Numbers (overall count used in this view)
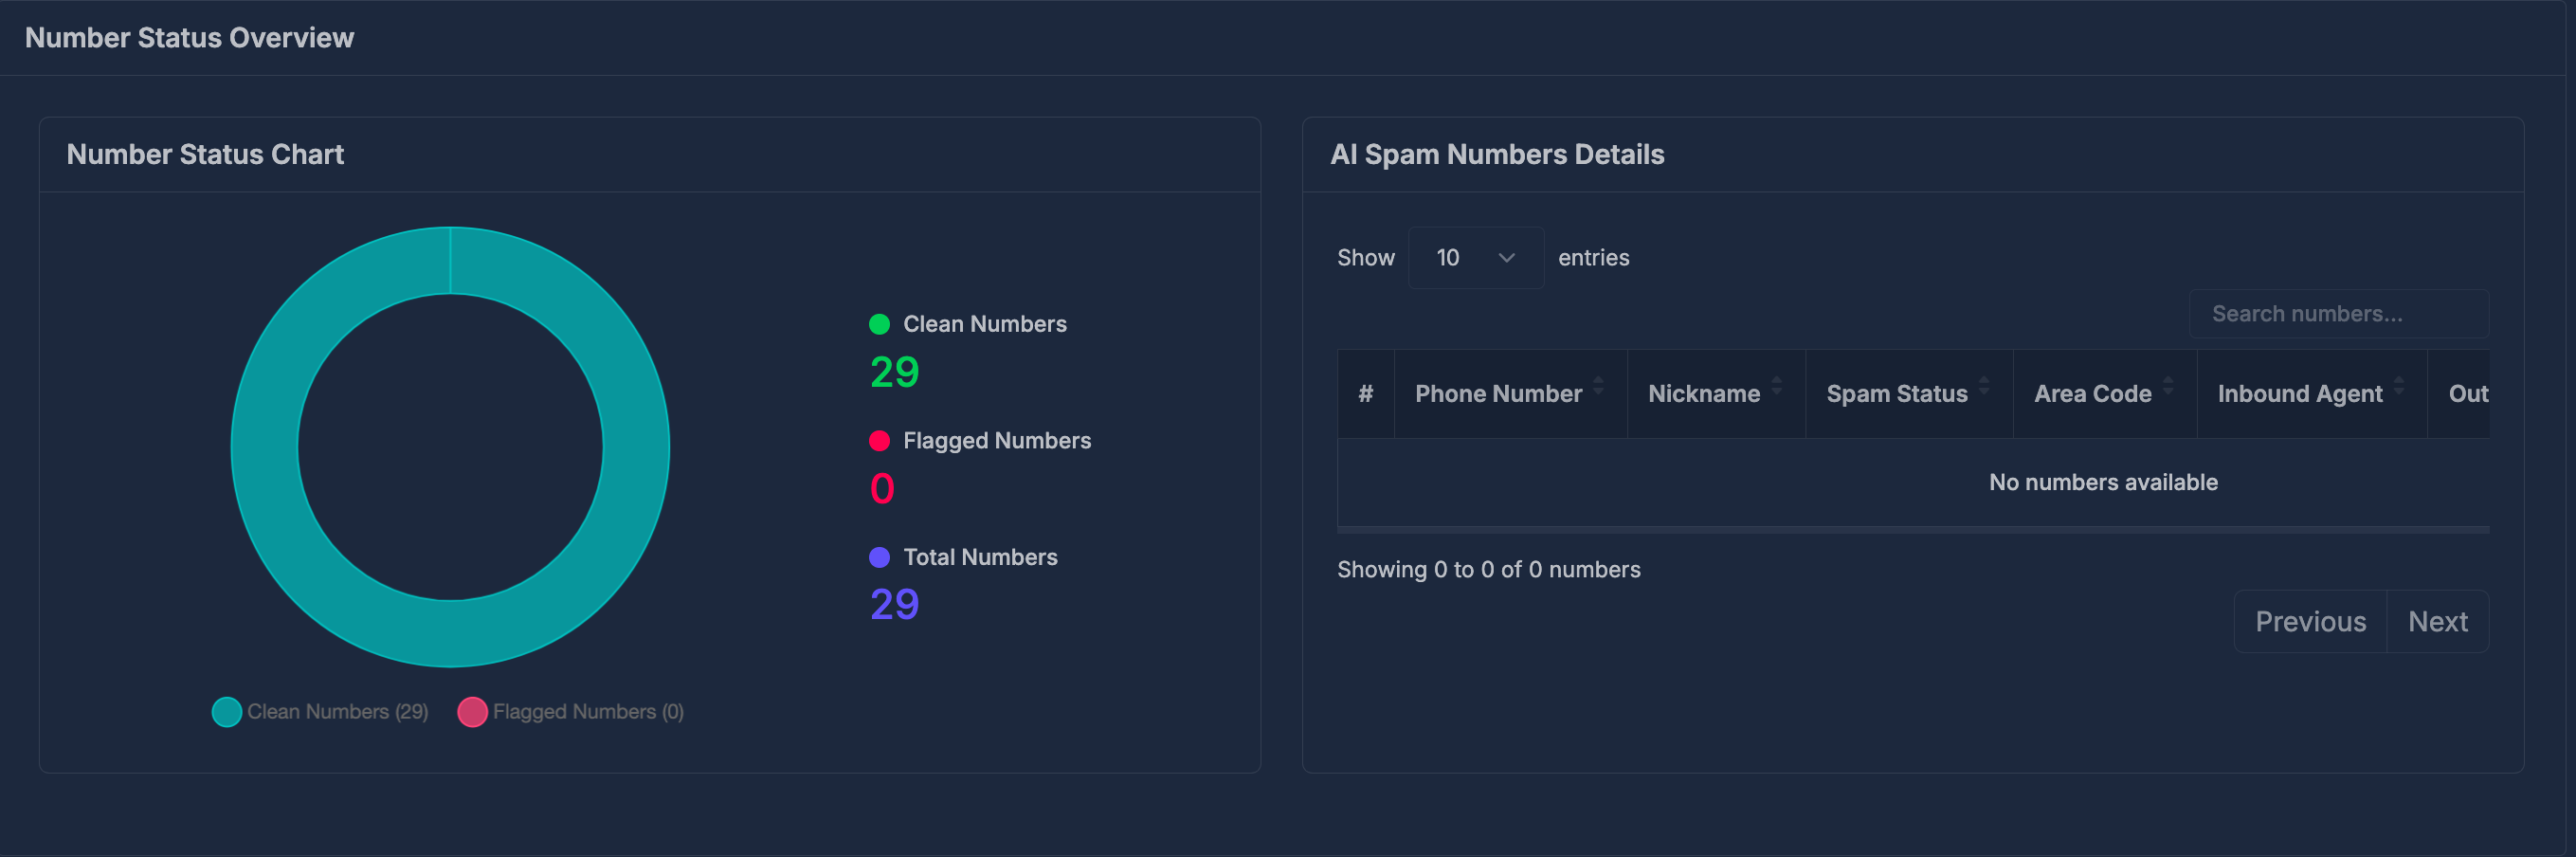
| Column | Meaning |
|---|---|
| # | Row number |
| Phone Number | The phone number |
| Nickname | The label you gave the number |
| Spam Status | Current status (for example flagged or in progress) |
| Area Code | Area code |
| Inbound Agent | Agent linked for inbound calls |
| Outbound Agent | Agent linked for outbound calls |
| Updated At | When the record was last updated |
📊 Call Analytics
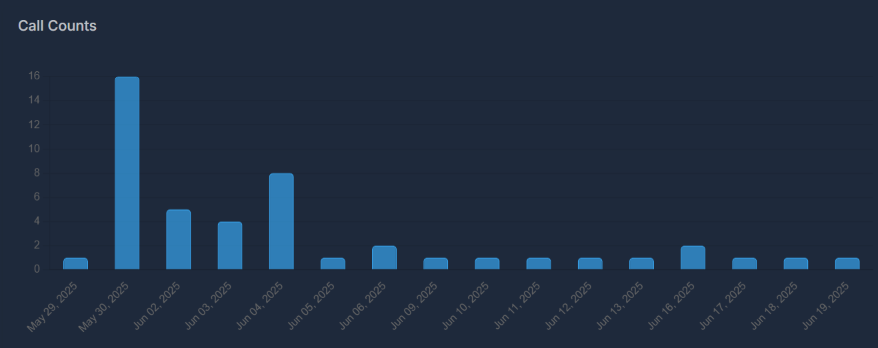
Charts in this section use your selected date range and agent. 📆 Call Counts- How many calls occurred on each day across the period.
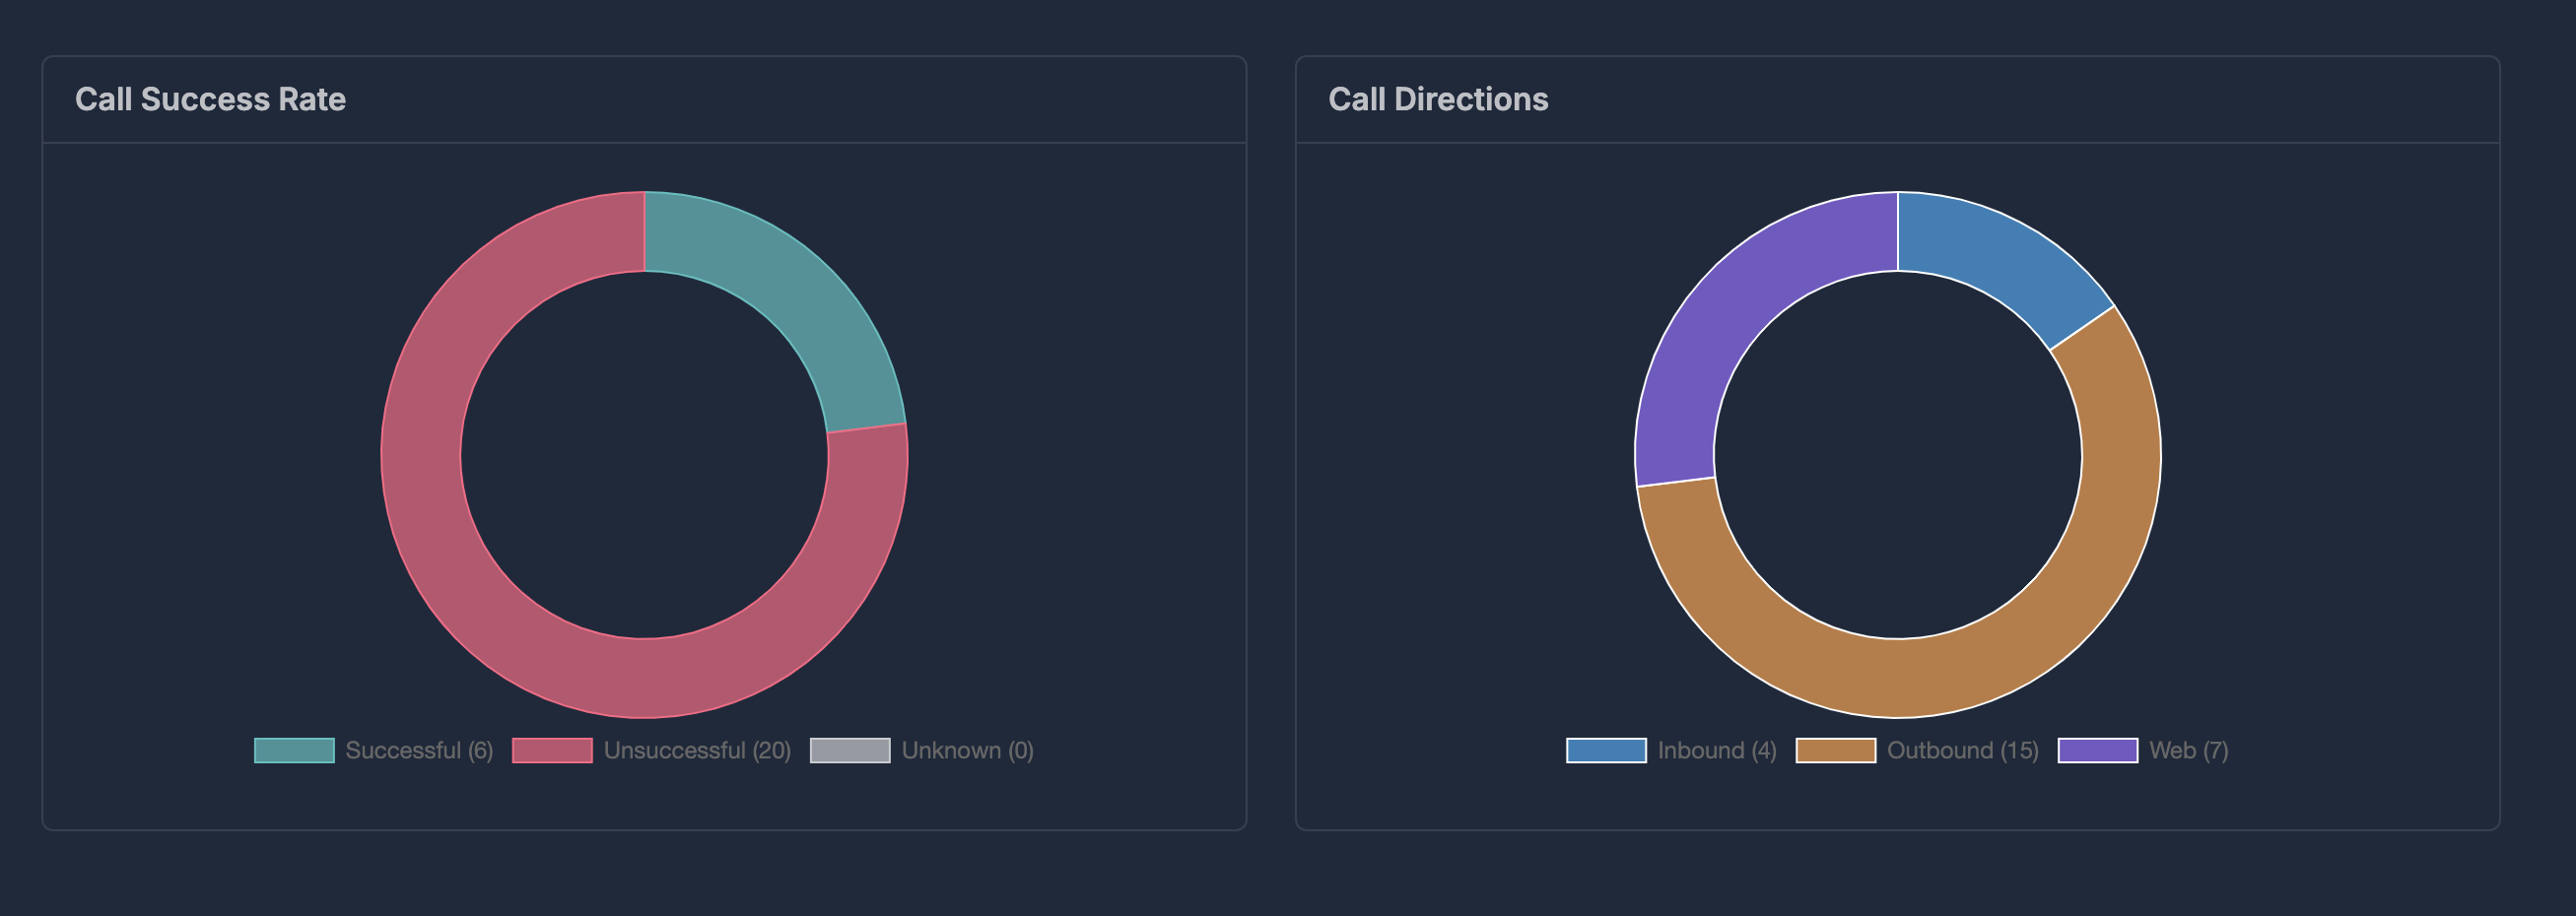
- Share of calls marked successful, unsuccessful, or unknown (ring-style chart).
- How many calls were inbound, outbound, or web.
- Why each call ended — for example caller hung up, assistant hung up, transfer, voicemail reached, busy line, no answer, or other connection or system situations. Counts are shown per reason type.
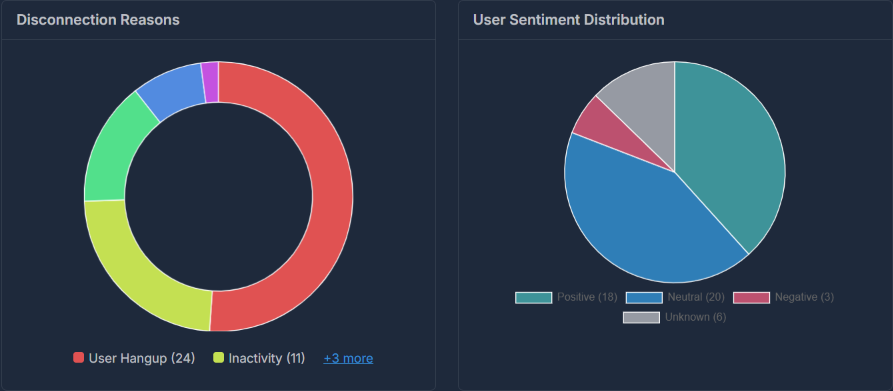
- How calls are split across Positive, Neutral, Negative, and Unknown sentiment.
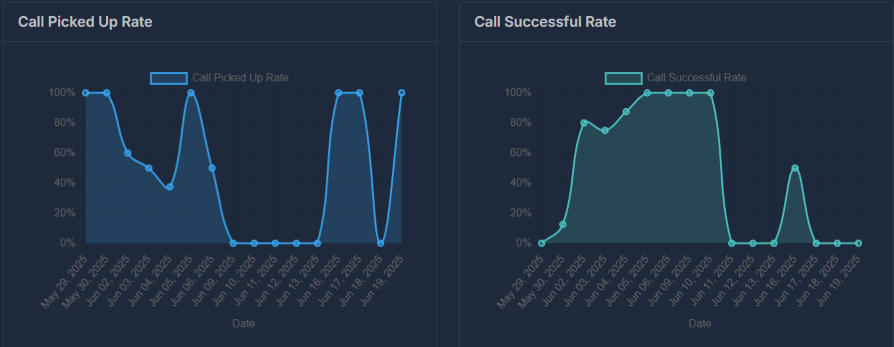
- Over time, the percentage of calls where the end reason indicates a connected conversation (for example caller hangup, assistant hangup, or transfer) versus all calls.
- Over time, the percentage of calls marked successful.
- Over time, the percentage of calls that ended in a transfer.
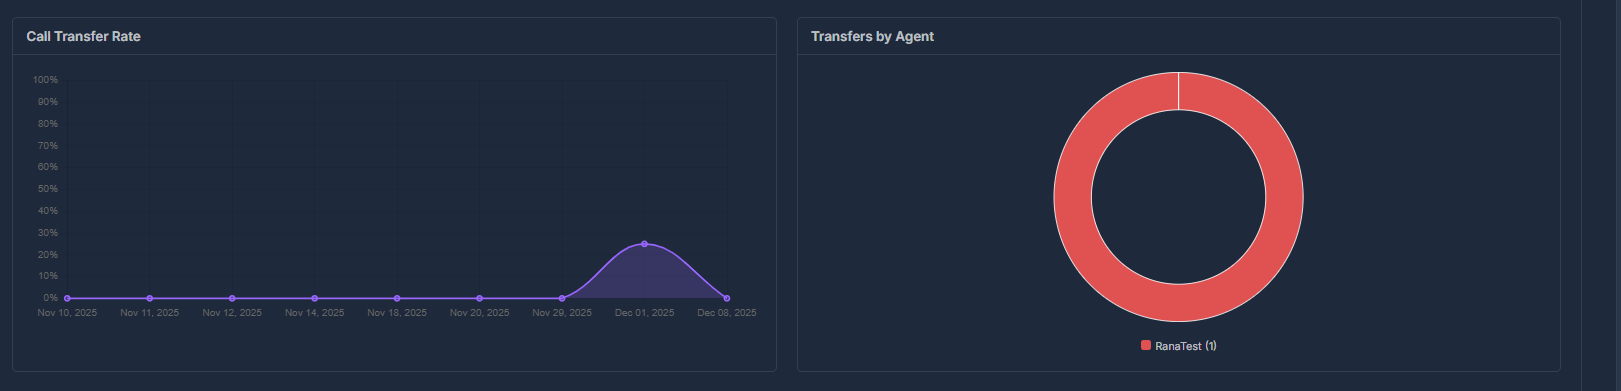
- Which AI agent transferred calls and how many times.

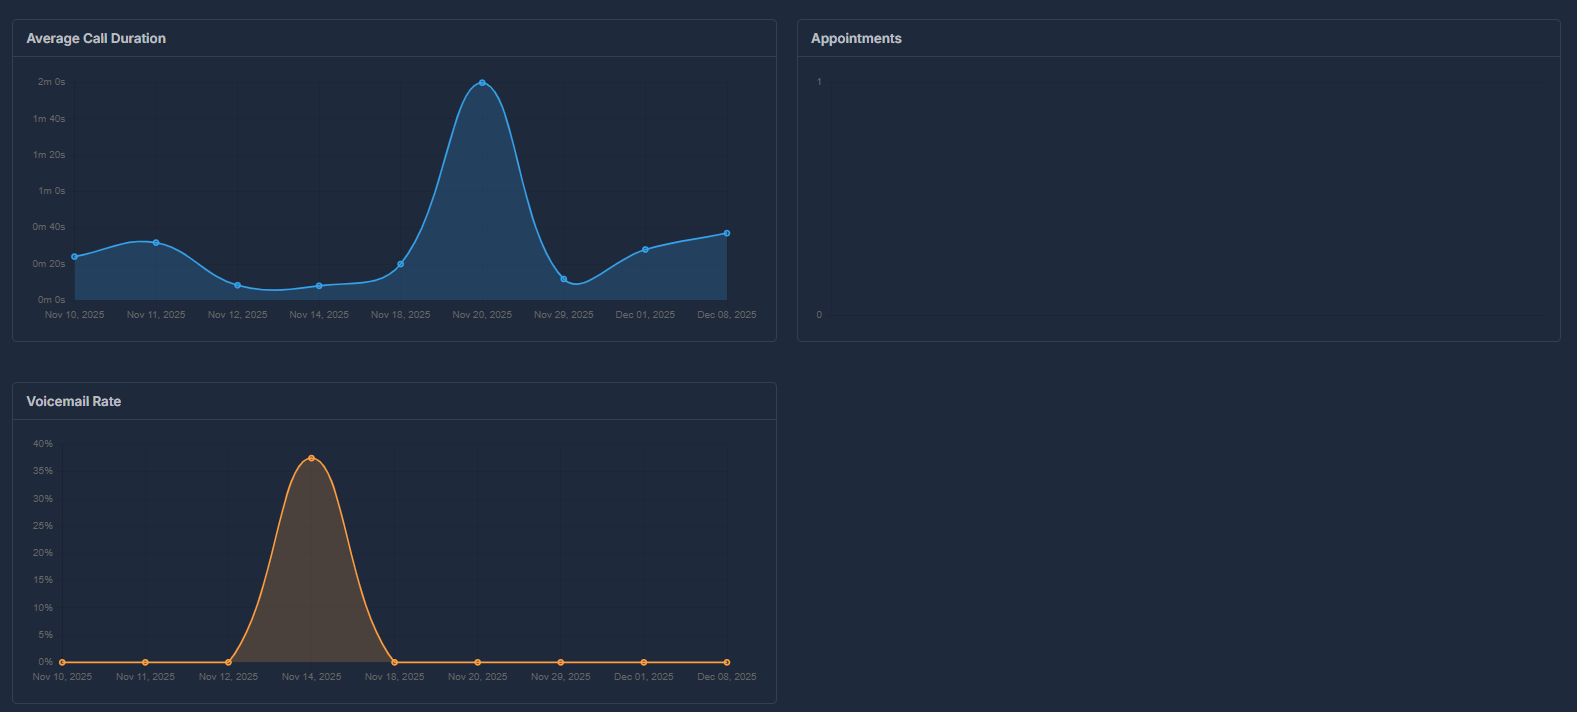
- Average call length by day over the period.
- Trend of appointment-related activity by day.
- Percentage of calls that reached voicemail.
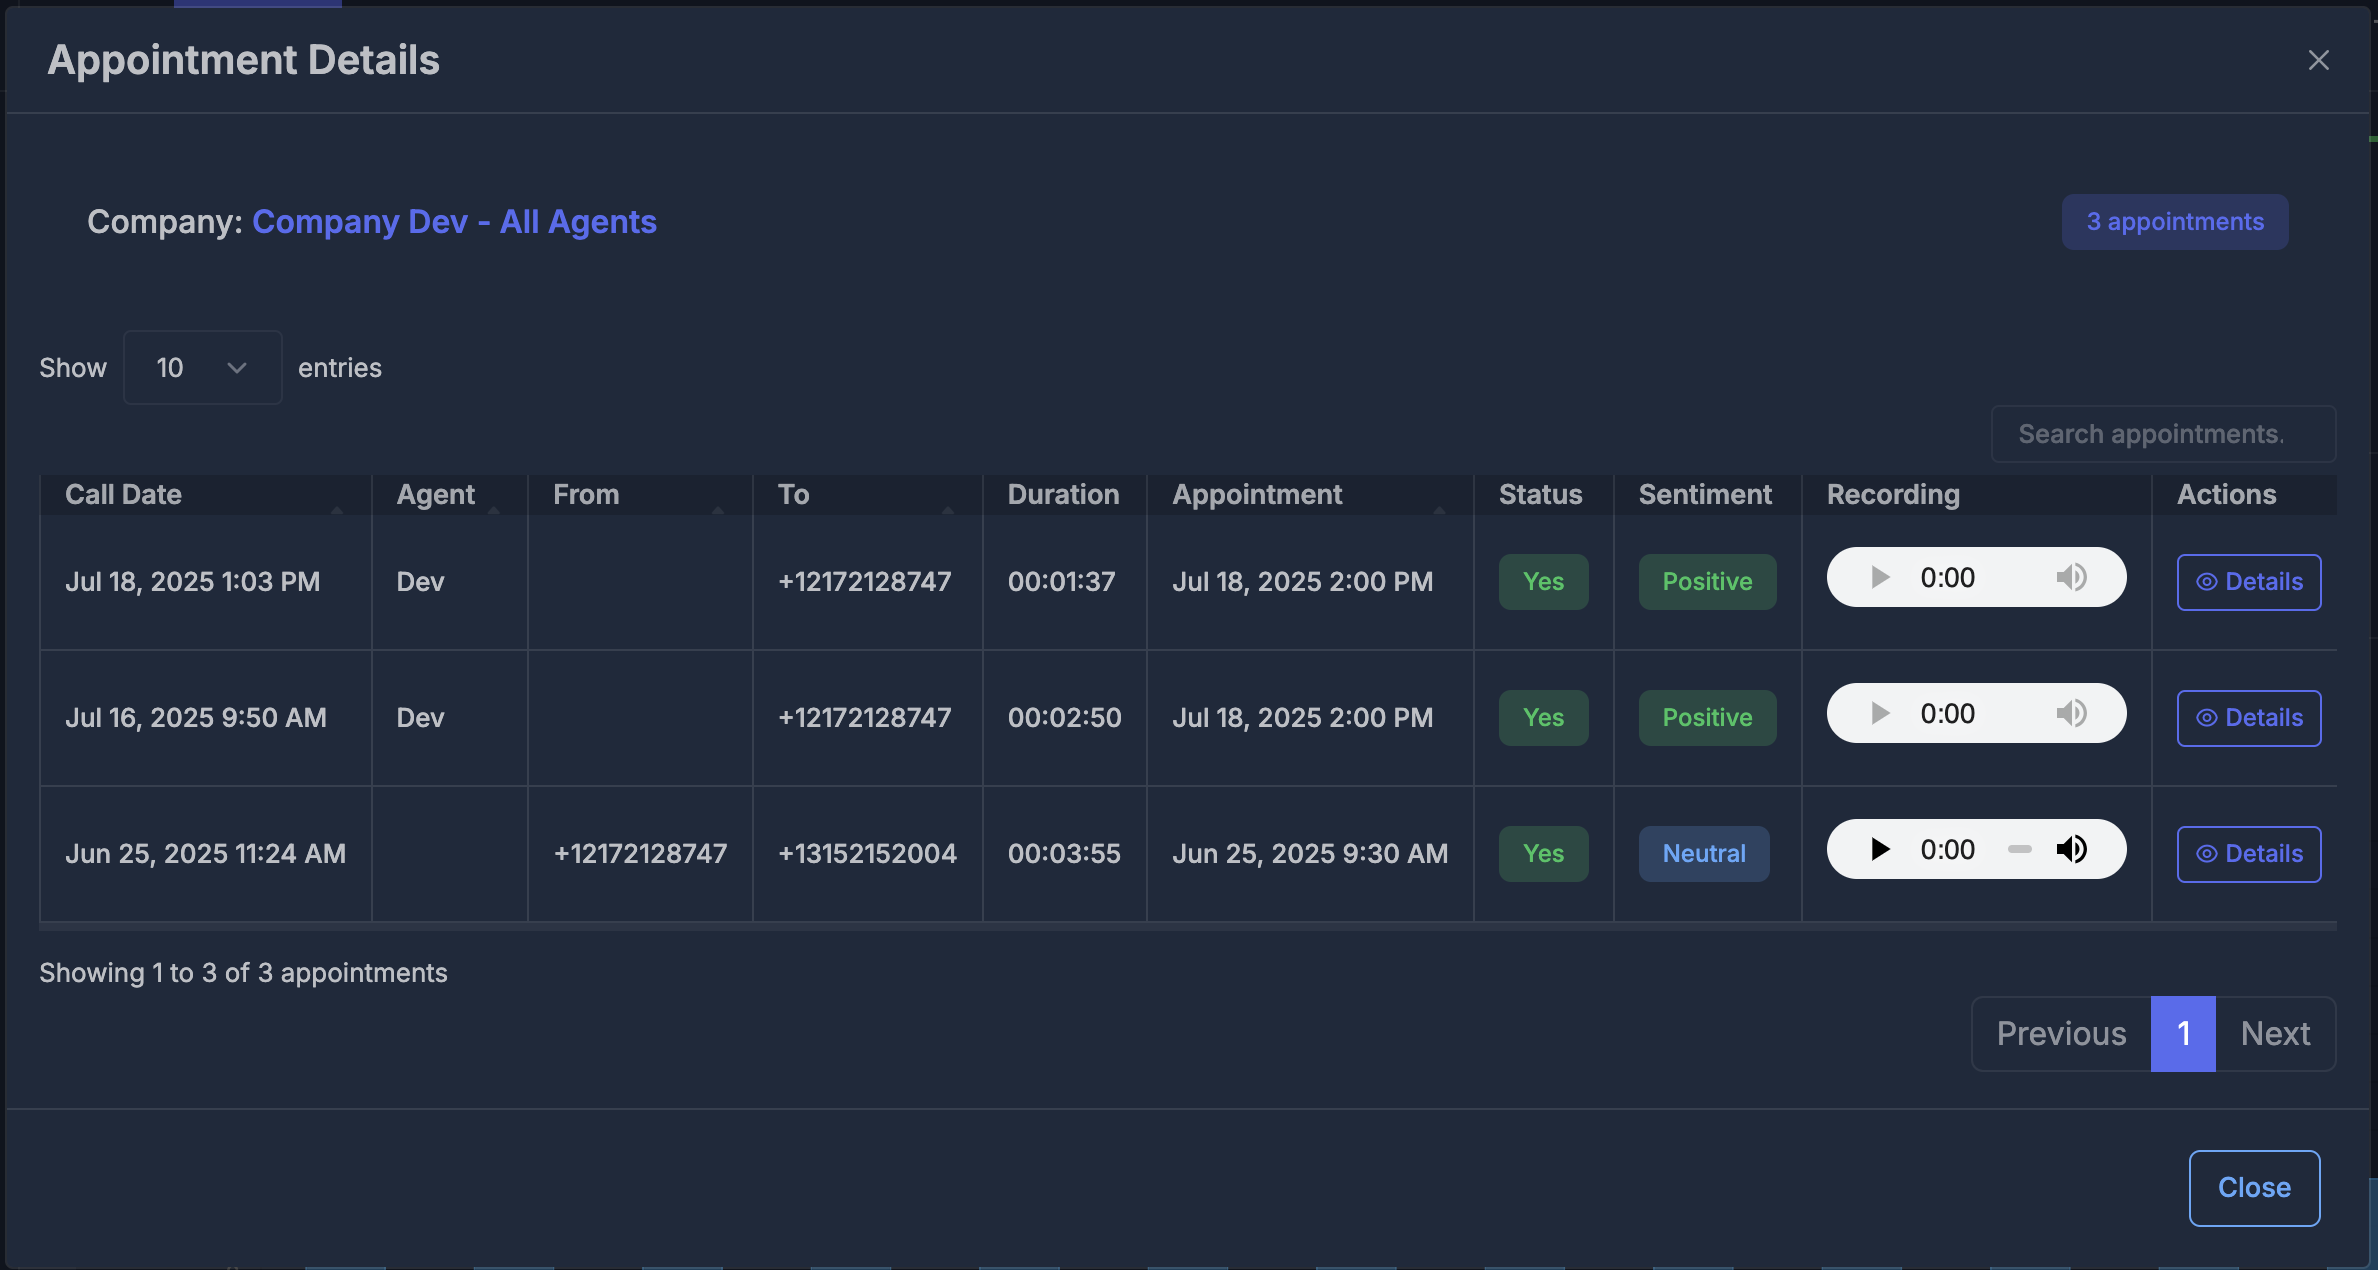
📆 Appointment Details panel
Opens when you click the Appointments summary card.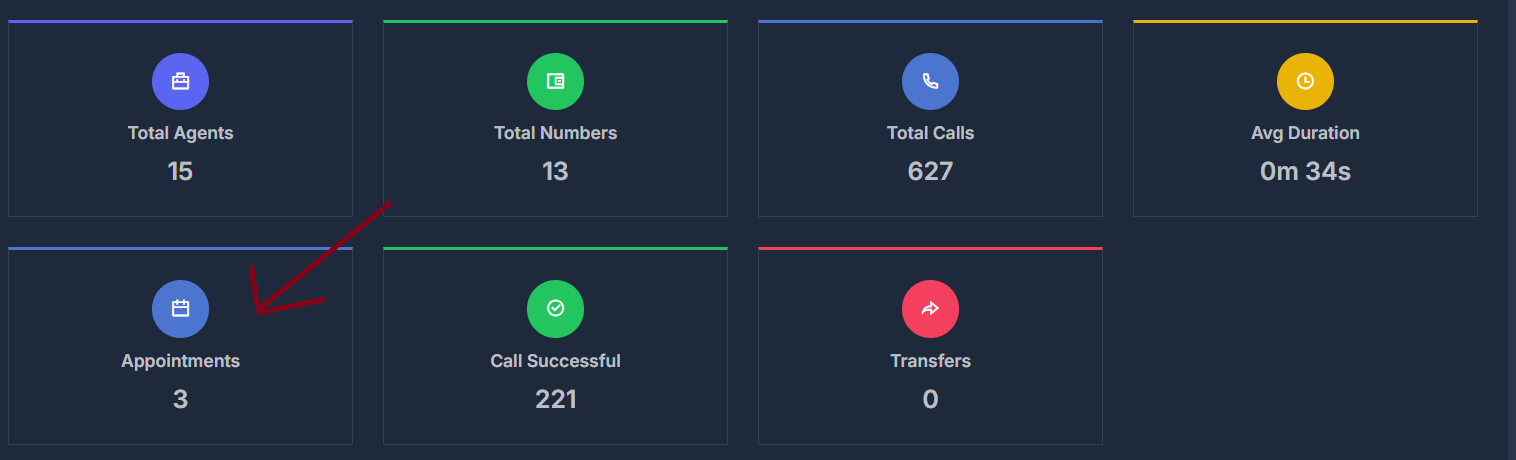
- Shows the company name and total appointment count at the top.
- Table columns typically include:
- Call Date — when the call happened
- Agent — which AI agent handled it
- From / To — calling and called numbers
- Duration — call length
- Appointment — booked appointment time
- Status — whether the call was marked successful
- Sentiment — sentiment label
- Recording — audio player if a recording exists
- Actions — Details to open full call information
📞 Call Details panel
Opens when you choose Details on a call row.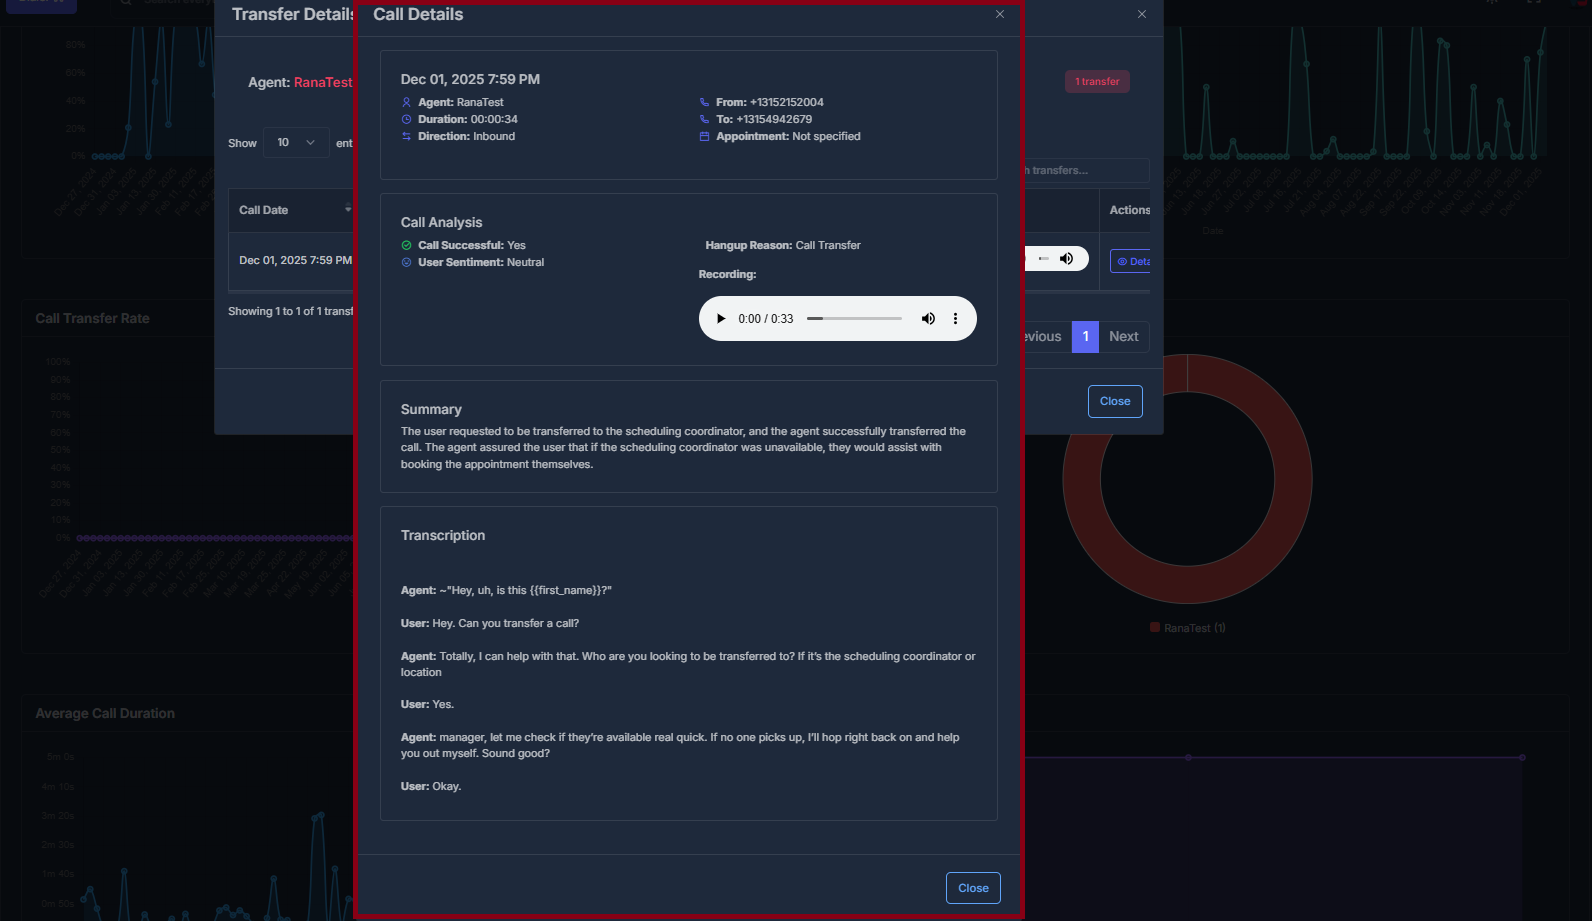
- Date and time, Agent, Duration, Direction (inbound, outbound, or web).
- From and To numbers.
- Appointment — scheduled time, or not specified.
- Call Analysis: whether the call was successful, user sentiment, and Hangup reason (why the call ended).
- Recording may appear with playback controls if available.
- If present, Summary and Transcription appear in separate sections; if not stored for that call, those sections stay hidden.
🔀 Transfer Details panel
Used for a detailed list of transfer calls when opened from the workflow that uses it.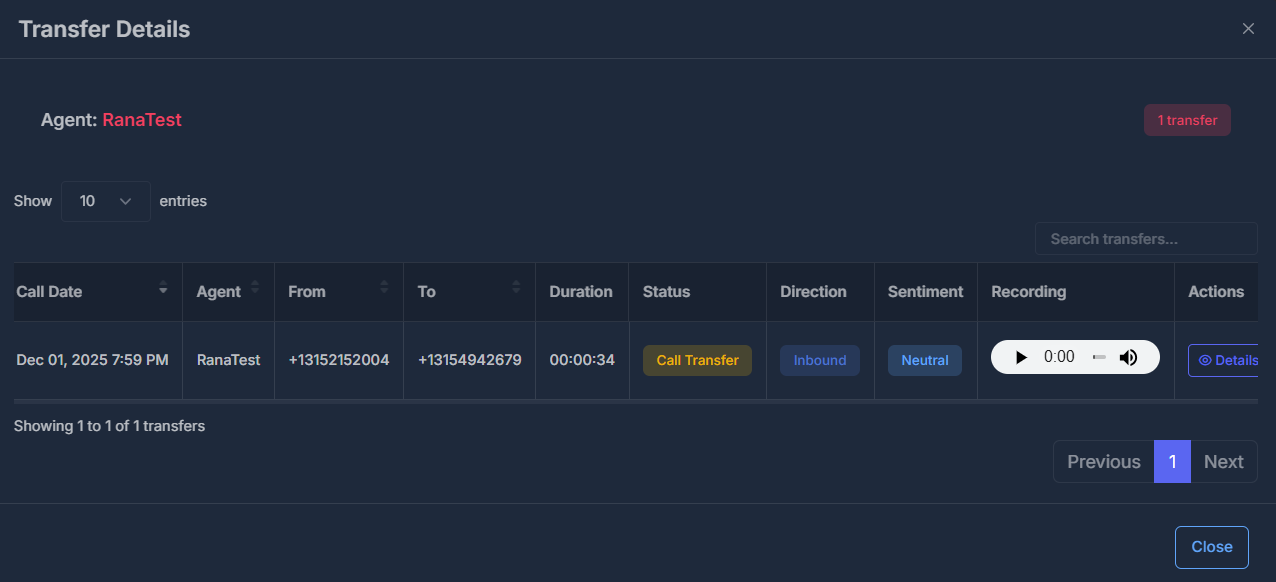
- Shows the Agent name and total transfer count at the top.
- Table: Call Date, Agent, From, To, Duration, Status, Direction, Sentiment, Recording, Actions (Details).